


Beautiful Bar Charts with Python and Matplotlib
⏱ Время чтения текста – 5 минутThe Matplotlib library provides a wide range of tools for Data Visualisation, allowing us to create compelling, expressive visualizations. But why then so many plots look so bland and boring? Back in 2011 we built a simple yet decent diagram for a telecommunication company report and named it ‘Thermometer’. Later this type of bars was exposed to a wide audience on Chandoo, which was a popular blog on Excel. By the way, here’s what it looks like:
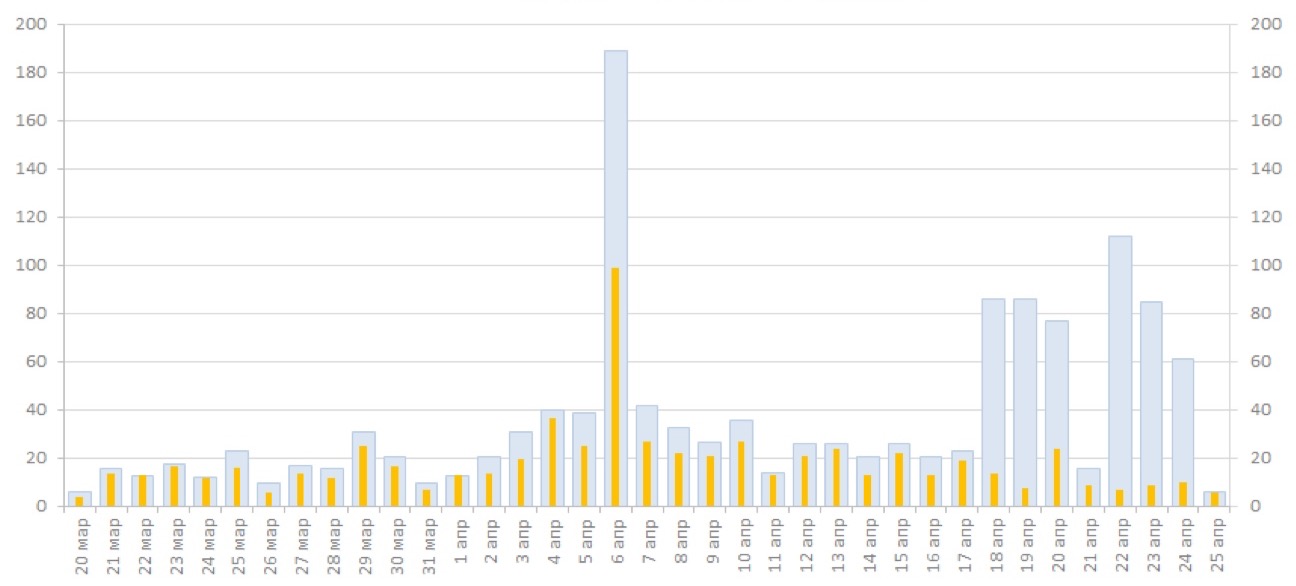
Times change, and today we’ll recall the way to plot this type of diagrams with the help of Matplotlib
When should one use this type of diagram?
The best way to plot this type of diagrams is when comparing target values with actual values because it reflects underfulfilment and overfulfilment of planned targets. A diagram may reflect data in percentages as well as in real figures. Let’s view an example using the latter.
We’ll use data stored in an excel file and already familiar python libraries for data analysis:
import numpy as np
import pandas as pd
import matplotlib.pyplot as plt
Read our file as a DataFrame:
df = pd.read_excel('data.xlsx')That’s what it looks like:
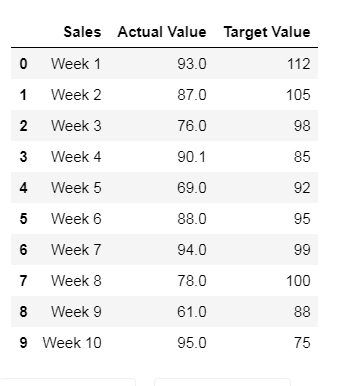
Now, we need to extract columns from the table. The first column called «Sales» will be displayed under each bar. Some values may be of a string type if there is a comma between two values. We need to convert these type of values by replacing a comma with a dot and converting them to floats.
xticks = df.iloc[:,0]
try:
    bars2 = df.iloc[:,1].str.replace(',','.').astype('float')
except AttributeError:
    bars2 = df.iloc[:,1].astype('float')
try:
    bars1 = df.iloc[:,2].str.replace(',','.').astype('float')
except AttributeError:
    bars1 = df.iloc[:,2].astype('float')
As we don’t know for sure if the table includes such values, our actions may cause an AttributeError . Fortunatelly for us, Python has a built-in try – except
method for handling such errors.
Let’s plot a simple side-by-side bar graph, setting a distance between two related values using a NumPy array:
barWidth = 0.2
r1 = np.arange(len(bars1))
r2 = [x + barWidth for x in r1]

plt.bar(r1, bars1, width=barWidth)
plt.bar(r2, bars2, width=barWidth)
And see what happens:

Obviously, this is not what we expected. Let’s try to set a different bar width to make bars overlapping each other.
barWidth1 = 0.065
barWidth2 = 0.032
x_range = np.arange(len(bars1) / 8, step=0.125)
We can plot the bars and set its coordinates, color, width, legend and signatures in advance:
plt.bar(x_range, bars1, color='#dce6f2', width=barWidth1/2, edgecolor='#c3d5e8', label='Target')
plt.bar(x_range, bars2, color='#ffc001', width=barWidth2/2, edgecolor='#c3d5e8', label='Actual Value')
for i, bar in enumerate(bars2):
    plt.text(i / 8 - 0.015, bar + 1, bar, fontsize=14)
Add some final touches – remove the frames, ticks, add a grey line under the bars, adjust font size and layout, make a plot a bit wider and save it as a .png file.
plt.xticks(x_range, xticks)
plt.tick_params(
    bottom=False,
    left=False,
    labelsize=15
)
plt.rcParams['figure.figsize'] = [25, 7]
plt.axhline(y=0, color='gray')
plt.legend(frameon=False, loc='lower center', bbox_to_anchor=(0.25, -0.3, 0.5, 0.5), prop={'size':20})
plt.box(False)
plt.savefig('plt', bbox_inches = "tight")
plt.show()
And here’s the final result:
