Later Ctrl + ↑

Sentiment analysis of Russians on Constitutional Amendments

Время чтения текста – 11 минут

In today’s article, we are going to use public data from vk.com to interpret and classify users’ attitudes about the 2020 amendments to the Constitution of Russia.

API Overview

First off, we need to receive data using the newsfeed.search method, this method allows us to get up to one thousand of the latest posts from the news feed by keyword.
The response data contains different fields, like post ids, user or community ids, text data, likes count, comments, apps, geolocation, and many more. We are only needed ids and text data.
Some expanded information about the author will also be useful for our analysis, this includes city, gender, age, and can be received with the users.get method.

Create Clickhouse Tables

The received data should be stored somewhere, we chose to use ClickHouse, an open-source column-oriented DBMS. Let’s create two tables to store users and their posts. The first table will be populated with ids and text data, the second one will hold user data, such as their ids, age, and city. The ReplacingMergeTree () engine will remove duplicates in our tables.

The article assumes that you’re familiar with how to install ClickHouse on AWS, create external dictionaries and  materialized views

CREATE TABLE vk_posts(
   post_id UInt64,
   post_date DateTime,
   owner_id UInt64,
   from_id UInt64,
   text String
) ENGINE ReplacingMergeTree()
ORDER BY post_date

CREATE TABLE vk_users(
   user_id UInt64,
   user_sex Nullable(UInt8),
   user_city String,
   user_age Nullable(UInt16)
) ENGINE ReplacingMergeTree()
ORDER BY user_id

Collecting user posts with the VK API

Let’s get to writing our script, import the libraries, and create several variables with constant values:

If you don’t have an access token yet and want to create one, refer to this step by step guide: “Collecting Data on Ad Campaigns from VK.com”

from clickhouse_driver import Client
from datetime import datetime
import requests
import pandas as pd
import time

token = 'your_token'
version = 5.103
client = Client(host='ec1-23-456-789-1011.us-east-2.compute.amazonaws.com', user='default', password='', port='9000', database='default')      
data_list = []
start_from = 0
query_string = 'конституция' #constitution

Define the get_and_insert_info_by_user function that will receive a list of user ids and expanded information about them, and send it to the vk_users table. Since the user_ids parameter takes a list as a string object, we need to change the structure and omit the square brackets.
Most users prefer to conceal their gender, age, and city. In such cases, we need to use Nullable values. To obtain user age we need to subtract the birth year from the current year, if the birth year is missing we can check it using the regular expression.


get_and_insert_info_by_user() function

def get_and_insert_info_by_user(users):
    try:
        r = requests.get('https://api.vk.com/method/users.get', params={
            'access_token':token,
            'v':version,
            'user_ids':str(users)[1:-2],
            'fields':'sex, city, bdate'
        }).json()['response']
        for user in r:
            user_list = []
            user_list.append(user['id'])
            if client.execute(f"SELECT count(1) FROM vk_users where user_id={user['id']}")[0][0] == 0:
                print(user['id'])
                try:
                    user_list.append(user['sex'])
                except Exception:
                    user_list.append('cast(Null as Nullable(UInt8))')
                try:
                    user_list.append(user['city']['title'])
                except Exception:
                    user_list.append('')
                try:
                    now = datetime.now()
    			    year = item.split('.')[-1]
    			    if re.match(r'\d\d\d\d', year):
        		        age = now.year - int(year)
			    	   user_list.append(age)
                except Exception:
                    user_list.append('cast(Null as Nullable(UInt16))')
                user_insert_tuple = tuple(user_list)
                client.execute(f'INSERT INTO vk_users VALUES {user_insert_tuple}')
    except KeyError:
        pass


Our script will work in a while loop to constantly update data, as we can only receive a thousand of the latest data points.The newsfeed.search method returns 200 posts per call, so we need to invoke it five times to collect all the posts.


While loop to collect new posts

while True:
    for i in range(5):
        r = requests.get('https://api.vk.com/method/newsfeed.search', params={
            'access_token':token,
            'v':version,
            'q':query_string,
            'count':200,
            'start_from': start_from
        })
        data_list.append(r.json()['response'])
        try:
            start_from = r.json()['response']['next_from']
        except KeyError:
            pass

The data we received can be parsed, VK users always have a positive id, while for communities it’s negative. We need only users data for our analysis, where from_id > 0. The next step is to check whether a post contains any text data or not. Finally, we will collect and store unique entries by user id. Pause the script after each iteration for 180 seconds to wait for new user posts and not violate the VK API rules.


Adding new data to Clickhouse

user_ids = []
    for data in data_list:
        for data_item in data['items']:
            if data_item['from_id'] > 0:
                post_list = []
                if not data_item['text']:
                    continue
                if client.execute(f"SELECT count(1) FROM vk_posts WHERE post_id={data_item['id']} AND from_id={data_item['from_id']}")[0][0] == 0:
                    user_ids.append(data_item['from_id'])
                    date = datetime.fromtimestamp(data_item['date'])
                    date = datetime.strftime(date, '%Y-%m-%d %H:%M:%S')
                    post_list.append(date)
                    post_list.append(data_item['id'])
                    post_list.append(data_item['owner_id'])
                    post_list.append(data_item['from_id'])
post_list.append(data_item['text'].replace("'","").replace('"','').replace("\n",""))
                    post_list.append(query_string)
                    post_tuple = tuple(post_list)
                    print(post_list)
                    try:
                        client.execute(f'INSERT INTO vk_posts VALUES {post_tuple}')
                    except Exception as E:
                        print('!!!!! try to insert into vk_post but got', E)
    try:
        get_and_insert_info_by_user(user_ids)
    except Exception as E:
        print("Try to insert user list:", user_ids, "but got:", E)
    time.sleep(180)

Dostoevsky for sentiment analysis

For one week our script collected almost 20000 posts from VK users that mention the keyword “constitution” (or “конституция” in Russian). It’s time to write our second script for data analysis and visualization. First, create a DataFrame with the data received, and evaluate the sentiment of each post, identifying whether it’s positive, negative, or neutral. We are going to use the Dostoevsky library to analyze the emotion behind a text.

from dostoevsky.tokenization import RegexTokenizer
from dostoevsky.models import FastTextSocialNetworkModel
from clickhouse_driver import Client
import pandas as pd
client = Client(host='ec1-23-456-789-1011.us-east-2.compute.amazonaws.com', user='default', password='', port='9000', database='default')

Assign all the contents of our table to the vk_posts variable with a simple query. Iterate through all the posts, select those with text data and populate our DataFrame.

vk_posts = client.execute('SELECT * FROM vk_posts')
list_of_posts = []
list_of_ids = []
for post in vk_posts:
    if str(post[-2]).replace(" ", ""):
        list_of_posts.append(str(post[-2]).replace("\n",""))
        list_of_ids.append(int(post[2]))
df_posts = pd.DataFrame()
df_posts['post'] = list_of_posts
df_posts['id'] = list_of_ids

Instantiate our model and iterate through the posts to evaluate the sentiment of each entry.

tokenizer = RegexTokenizer()
model = FastTextSocialNetworkModel(tokenizer=tokenizer)
sentiment_list = []
results = model.predict(list_of_posts, k=2)
for sentiment in results:
    sentiment_list.append(sentiment)

Add several boolean columns to our DataFrame that will reflect whether it’s a  positive, negative, or neutral post.

neutral_list = []
negative_list = []
positive_list = []
speech_list = []
skip_list = []
for sentiment in sentiment_list:
    neutral = sentiment.get('neutral')
    negative = sentiment.get('negative')
    positive = sentiment.get('positive')
    if neutral is None:
        neutral_list.append(0)
    else:
        neutral_list.append(sentiment.get('neutral'))
    if negative is None:
        negative_list.append(0)
    else:
        negative_list.append(sentiment.get('negative'))
    if positive is None:
        positive_list.append(0)
    else:
        positive_list.append(sentiment.get('positive'))
df_posts['neutral'] = neutral_list
df_posts['negative'] = negative_list
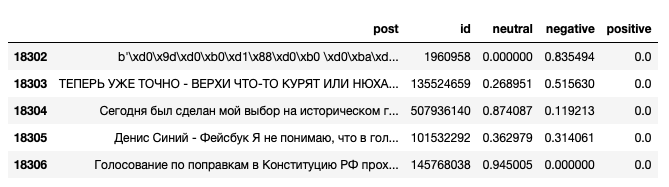
df_posts['positive'] = positive_list

That’s how the DataFrame looks now:

Let’s examine the most negative posts:

df_posts[df_posts.negative > 0.9]

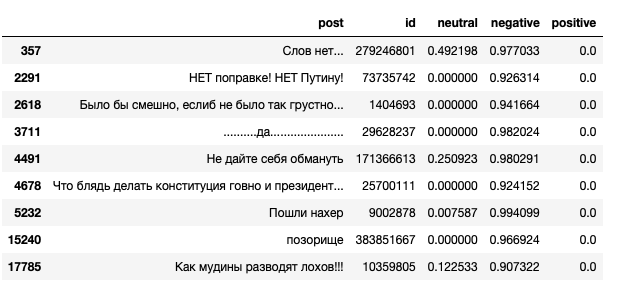
Now, let’s add data about the authors of these posts by merging two tables together on the id column.

vk_users = client.execute('SELECT * FROM vk_users')
vk_user_ids_list = []
vk_user_sex_list = []
vk_user_city_list = []
vk_user_age_list = []
for user in vk_users:
    vk_user_ids_list.append(user[0])
    vk_user_sex_list.append(user[1])
    vk_user_city_list.append(user[2])
    vk_user_age_list.append(user[3])
df_users = pd.DataFrame()
df_users['id'] = vk_user_ids_list
df_users['sex'] = vk_user_sex_list
df_users['city'] = vk_user_city_list
df_users['age'] = vk_user_age_list
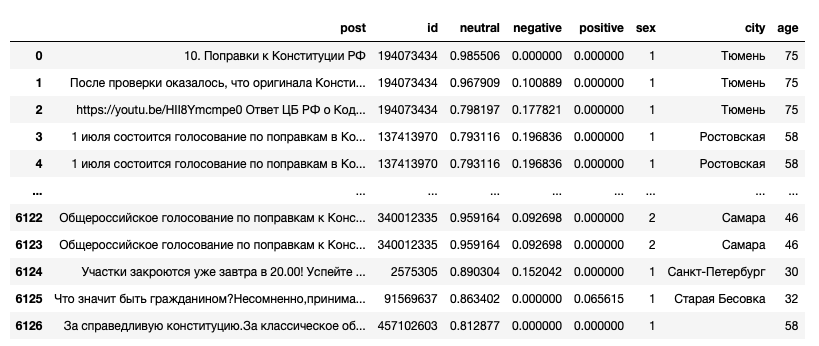
df = df_posts.merge(df_users, on='id')

And the table now looks the following:

Analysing data with Plotly

Check out our previous article on data visualization with Plotly: Building an interactive waterfall chart in Python

Let’s find the percentage of posts for each group: positive, negative, neutral. Iterate through these three columns and calculate the values more than zero for each data point. Then do the same for different age categories and gender.

According to our chart, 45% of recent user posts relevant to the keyword “constitution” have a negative meaning, while the other 52% are neutral. Later it’ll be known how different the Internet opinions from the voting results.

It’s noticeable that among the men audience the proportion of positive posts is less than 2%, while for women it’s 3.5%. However, the number of negative posts for each group is almost the same, 47% and 43% respectively.

According to our analysis, posts made by younger audiences between 18-25 years have more positive sentiment, which is 6%. While users under 18 years leave mostly negative posts, this may be because most users under the age of 18 prefer to hide their real age, this makes it difficult to obtain accurate data for such a group.
The proportion of negative posts is almost equal for all groups and accounts for 44%.
As you can see, the data is distributed equally in all three charts. This means that half of all posts relevant to the keyword “constitution” and made by VK users over the past week mostly have a negative sentiment.

 No comments    483   2020   Analytics engineering   data analytics   plotly

Handling website buttons in Selenium

Время чтения текста – 8 минут

In our previous article, Parsing the data of site’s catalogue, using Beautiful Soup and Selenium we have addressed the problem of working with dynamic pages, but sometimes this method doesn’t work, as with “Show more” buttons. Today we will show how you can imitate button click with Selenium to load a whole page, collect beer IDs, ratings, and send the data to Clickhouse.

Webpage structure

Let’s take a random brewery that has 105 check-ins, or customer feedbacks. One page with check-ins displays up to 25 records and looks like this:

If we try to scroll down to the bottom, we will encounter the same button that prevents us from getting all 105 records at once:

First off, to address this task, let’s find out the button class and just click it until it works. Since Selenium launches the browser and the next “Show more” button may not be loaded in time, that’s why we set 2-second intervals between the clicks. As soon as the page is loaded we will take its content and parse the relevant data.
Let’s view the source code and  find the button, it’s assigned to the more_checkins class.

The button has style attributes, such as display. When the button is displayed this attribute takes the block value. But when we scroll the page to the buttom and there is nothing left to display, the attribute takes the none value and we can stop clicking.

Writing our code

Let’s import the necessary libraries

import time
from selenium import webdriver
from bs4 import BeautifulSoup as bs
import re
from datetime import datetime
from clickhouse_driver import Client

Chromedriver is used to run Selenium tests on Chrome and can be downloaded from the official website

Connect to the database and create cookies:

client = Client(host='ec1-23-456-789-10.us-east-2.compute.amazonaws.com', user='', password='', port='9000', database='')
count = 0
cookies = {
    'domain':'untappd.com',
    'expiry':1594072726,
    'httpOnly':True,
    'name':'untappd_user_v3_e',
    'path':'/',
    'secure':False,
    'value':'your_value'
}

You can find out more about working with cookies in Selenium from Parsing the data of site’s catalogue, using Beautiful Soup and Selenium. We will need the untappd_user_v3_e parameter.

As we are going to work with pages that have more than hundreds of thousands of records, it’s pretty heavy and our instance may be overloaded. To prevent this, we will shut down unnecessary parts and then enable authentication cookie:

options = webdriver.ChromeOptions()
prefs = {'profile.default_content_setting_values': {'images': 2, 
                            'plugins': 2, 'fullscreen': 2}}
options.add_experimental_option('prefs', prefs)
options.add_argument("start-maximized")
options.add_argument("disable-infobars")
options.add_argument("--disable-extensions")
driver = webdriver.Chrome(options=options)
driver.get('https://untappd.com/TooSunnyBrewery')
driver.add_cookie(cookies)

We will need a function that would take a link, open it in the browser, load a whole page and return a soup object to be parsed. Get the  display attribute, assign it to the more_checkins: variable and click the button until the attribute is none. Let’s set 2-second intervals between the clicks, to wait for the page to load. As soon as we received the page, converth it into a soup object using the bs4 library.

def get_html_page(url):
    driver.get(url)
    driver.maximize_window()
    more_checkins = driver.execute_script("var more_checkins=document.getElementsByClassName('more_checkins_logged')[0].style.display;return more_checkins;")
    print(more_checkins)
    while more_checkins != "none":
        driver.execute_script("document.getElementsByClassName('more_checkins_logged')[0].click()")
        time.sleep(2)
        more_checkins = driver.execute_script("var more_checkins=document.getElementsByClassName('more_checkins_logged')[0].style.display;return more_checkins;")
        print(more_checkins)
    source_data = driver.page_source
    soup = bs(source_data, 'lxml')
    return soup

Write the following function that will take a page url, pass it in the get_html_page and receive a soup object to parse. The function returns zipped lists with beer IDs and ratings.

See how you can use Beautiful Soup to retrieve data from a website catalogue

def parse_html_page(url):
    soup = get_html_page(url)
    brewery_id = soup.find_all('a', {'class':'label',
                                     'href':re.compile('https://untappd.com/brewery/*')})[0]['href'][28:]
    items = soup.find_all('div', {'class':'item',
                                  'id':re.compile('checkin_*')})
    checkin_rating_list = []
    beer_id_list = []
    count = 0
    print('Filling the lists')
    for checkin in items:
        print(count, '/', len(items))
        try:
            checkin_rating_list.append(float(checkin.find('div', {'class':'caps'})['data-rating']))
        except Exception:
            checkin_rating_list.append('cast(Null as Nullable(Float32))')
        try:
            beer_id_list.append(int(checkin.find('a', {'class':'label'})['href'][-7:]))
        except Exception:
            beer_id_list.append('cast(Null as Nullable(UInt64))')
        count += 1 
    return zip(checkin_rating_list, beer_id_list)

Finally, write a function call for the breweries. We’ve covered how to receive a list of Russian brewery IDs in this article: Example of using dictionaries in Clickhouse with Untappd.
Let’s fetch it from the Clickhouse table.

brewery_list = client.execute('SELECT brewery_id FROM brewery_info')

If we print out the brewery_list, we will find out that the data is stored in a list of tuples.

Let’s make it a bit prettier with the lambda expression:

flatten = lambda lst: [item for sublist in lst for item in sublist]
brewery_list = flatten(brewery_list)

That’s much better:

Create a url for each brewery in the list, it includes a standard link and a brewery ID in the end. Pass it to the parse_html_page function that fetches the get_html_page and return lists with beer_id and rating_score. Since the lists are zipped, we can iterate throught them, create a tuple and send it to Clickhouse.

for brewery_id in brewery_list:
    print('Fetching the brewery with id', brewery_id, count, '/', len(brewery_list))
    url = 'https://untappd.com/brewery/' + str(brewery_id)
    returned_checkins = parse_html_page(url)
    for rating, beer_id in returned_checkins:
        tuple_to_insert = (rating, beer_id)
        try:
            client.execute(f'INSERT INTO beer_reviews VALUES {tuple_to_insert}')
        except errors.ServerException as E:
            print(E)
    count += 1

That’s it about the way we can handle “Show more” buttons. Over time we will form a large dataset for further analysis, to work with in our next series.

 No comments    384   2020   Amazon Web Services   Analytics engineering   AWS   clickhouse   python

Example of using dictionaries in Clickhouse with Untappd

Время чтения текста – 12 минут

In Clickhouse we can use internal dictionaries as well as external dictionaries, they can be an alternative to JSON that doesn’t always work fine. DIctionaries store information in memory and can be invoked with the dictGet method. Let’s review how we can create one in Clickhouse and use it for our queries.

We will illustrate an example of data using the Untappd API. Untappd is a social network for everyone who loves craft beer. We are going to use сheck-ins of Russian-based craft breweries and start collecting information about them to analyze this data later on and to draw some conclusions. in today’s article, we will analyze how to receive metadata on Russian breweries with Untappd and store it in a Clickhouse dictionary.

Collecting data with Untappd

First off, we need to create a new app to receive client_id and  client_secret_key to make API calls. Follow  this link and fill in the fields:

Usually, it takes about 1 to 3 weeks to wait for approval.

import requests
import pandas as pd
import time

We’ll be using the requests library to make API calls, view results in a Pandas DataFrame, and save them in a CSV file before sending it to a Clickhouse dictionary. Untappd has strict limits on the number of requests, prohibiting us to make more than 100 calls per hour. Therefore, we need to make our script wait for 38 seconds using the Python time module.

client_id = 'your_client_id'
client_secret = 'your_client_secret'
all_brewery_of_russia = []

We want to get data for one thousand Russian breweries. One request to the Brewery Search method enables us to view up to 50 breweries. The website gave us 3369 breweries when searching the word “Russia” manually.

Let’s check this, scroll down to the bottom, and open the page code.

Each brewery received is stored in the beer-item class. This means we can the number of references to beer-item:

And as it turned out, we have exactly 1000 breweries, not 3369. When searching the word “Russia” manually, the results also contain some American breweries. So, we need to make 20 calls, getting 50 breweries at a time:

for offset in range(0, 1000, 50):
    try:
        print('offset = ', offset)
        print('remained:', 1000 - offset, '\n')
        response = requests.get(f'https://api.untappd.com/v4/search/brewery?client_id={client_id}&client_secret={client_secret}',
                               params={
                                   'q':'Russia',
                                   'offset':offset,
                                   'limit':50
                               })
        item = response.json()
        print(item, '\n')
        all_brewery_of_russia.append(item)
        time.sleep(37)
    except Exception:
        print(Exception)
        continue

The Brewery Search method includes several parameters, q – a string with a country name (specify specify “Russia” to get all the breweries based in Russia), offset – allows us to shift by 50 lines in the search to get the next list of breweries, limit – restricts the number of breweries received and can not be more than 50. Convert the answer to JSON and append data sotred in the item object to the  all_brewery_of_russia list.

Our data may also include breweries from other countries. That’s why we need to filter the data. Iterate through the all_brewery_of_russia list and keep only those breweires, which country_name is Russia.

brew_list = []
for element in all_brewery_of_russia:
    brew = element['response']['brewery']
    for i in range(brew['count']):
        if brew['items'][i]['brewery']['country_name'] == 'Russia':
            brew_list.append(brew['items'][i])

Print out the first element in our brew_list:

print(brew_list[0])

Create a DataFrame with the following columns: brewery_id, beer_count, brewery_name, brewery_slug, brewery_page_url, brewery_city, lat и  lng. And several lists to sort out the data stored in the brewery_list:

df = pd.DataFrame()
brewery_id_list = []
beer_count_list = []
brewery_name_list = []
brewery_slug_list = []
brewery_page_url_list = []
brewery_location_city = []
brewery_location_lat = []
brewery_location_lng = []
for brewery in brew_list:
    brewery_id_list.append(brewery['brewery']['brewery_id'])
    beer_count_list.append(brewery['brewery']['beer_count'])
    brewery_name_list.append(brewery['brewery']['brewery_name'])
    brewery_slug_list.append(brewery['brewery']['brewery_slug'])
    brewery_page_url_list.append(brewery['brewery']['brewery_page_url'])
 brewery_location_city.append(brewery['brewery']['location']['brewery_city'])
    brewery_location_lat.append(brewery['brewery']['location']['lat'])
    brewery_location_lng.append(brewery['brewery']['location']['lng'])

Assign them as column values:

df['brewery_id'] = brewery_id_list
df['beer_count'] = beer_count_list
df['brewery_name'] = brewery_name_list
df['brewery_slug'] = brewery_slug_list
df['brewery_page_url'] = brewery_page_url_list
df['brewery_city'] = brewery_location_city
df['brewery_lat'] = brewery_location_lat
df['brewery_lng'] = brewery_location_lng

And view our DataFrame:

df.head()

Let’s sort the values by brewery_id and store our DataFrame as a CSV file without index column and headings:

df = df.sort_values(by='brewery_id')
df.to_csv('brewery_data.csv', index=False, header=False)

Creating a Clickhouse dictionary

You can create Clickouse dictionaries in many different ways. We will try to structure it in an XML file, configure the server files, and access it through our client. The XML file structure will be the following:

Learn more about other ways you can create Clickhouse dictionaries in the documentation

<yandex>
<dictionary>
        <name>breweries</name>
        <source>
                <file>
                        <path>/home/ubuntu/brewery_data.csv</path>
                        <format>CSV</format>
                </file>
        </source>
        <layout>
                <flat />
        </layout>
        <structure>
                <id>
                        <name>brewery_id</name>
                </id>
                <attribute>
                        <name>beer_count</name>
                        <type>UInt64</type>
                        <null_value>Null</null_value>
                </attribute>
                <attribute>
                        <name>brewery_name</name>
                        <type>String</type>
                        <null_value>Null</null_value>
                </attribute>
                <attribute>
                        <name>brewery_slug</name>
                        <type>String</type>
                        <null_value>Null</null_value>
                </attribute>
                <attribute>
                        <name>brewery_page_url</name>
                        <type>String</type>
                        <null_value>Null</null_value>
                </attribute>
                <attribute>
                        <name>brewery_city</name>
                        <type>String</type>
                        <null_value>Null</null_value>
                </attribute>
                <attribute>
                        <name>lat</name>
                        <type>String</type>
                        <null_value>Null</null_value>
                </attribute>
                <attribute>
                        <name>lng</name>
                        <type>String</type>
                        <null_value>Null</null_value>
                </attribute>
        </structure>
        <lifetime>300</lifetime>
</dictionary>
</yandex>

name is a dictionary name, attribute holds the properties of the columns, id is a key field, file stores file path and format. We are going to store our file in this directory: /home/ubuntu.

Let’s upload our CSV and XML files to the server, it can be done using an FTP like FileZilla. We explained how to deploy Clickhouse on an Amazon instance in our previous article, this time need to do the same. Open your FileZilla client and go to SFTP settings to add a private key:

Connect to your server address, it can be found in the EC2 management console. Specify SFTP as a protocol, your Host, and Ubuntu as a username.

Your Public DNS may change in case of overload

After connecting we will wind up in this location /home/ubuntu. Let’s put the files in that folder and connect via SSH using Termius. Then we need to move the files to /etc/clickhouse-server to view them in Clickhouse:

Learn how you can connect to an AWS server using SSH client from our previous material Installing Clickhouse on AWS

sudo mv breweries_dictionary.xml /etc/clickhouse server/

Go to the config file:

cd /etc/clickhouse-server
sudo nano config.xml

We need the  tag, it’s the path to a file that describes the dictionaries structure. Specify the path to our XML file:

<dictionaries_config>/etc/clickhouse-server/breweries_dictionary.xml</dictionaries_config>

Save our file and run the Clickhouse client:

clickhouse client

Let’s check that the dictionary really loaded:

SELECT * FROM system.dictionaries\G

In case of success you will get the following:

Now, let’s write a query with the  dictGet function to get the name of the brewery with ID 999. Pass in the dictionary name, as the first argument, then the filed name and ID.

SELECT dictGet('breweries', 'brewery_name', toUInt64(999))

And our query returns this:

Similarly, we could use this function to get a beer name, when the table contains only IDs.

 No comments    1742   2020   Amazon Web Services   Analytics engineering   clickhouse   data analytics   python

SQL Window Functions Cheat Sheet with examples

Время чтения текста – 1 минута

Window functions are calculation functions that can increase the efficiency and reduce the complexity of SQL queries, making things much easier:
View as  PDF

Special Thanks to LearnSQL, best place to master your SQL skills !

 No comments    1798   2020   Analytics engineering   sql

Collecting Data on Ad Campaigns from VK.com

Время чтения текста – 11 минут

We have a lot to share in today’s longread: we’ll retrieve data on ad campaigns from Vkontakte (widely popular social network in Russia and CIS countries) and compare them to Google Analytics data in Redash. This time we don’t need to create a server, as our data will be transferred to Google Docs via Google Sheets API.

Getting an Access Token
We need to create an app to receive our access token. Follow this link https://vk.com/apps?act=manage and click “Create app” on the developer’s page. Choose a name for your app and check it as a “Standalone app”. Then, click Settings in the left menu and save your app ID.

More details on access tokens can be found here: Getting an access token

Copy this link:

https://oauth.vk.com/authorize?client_id=YourClientID&scope=ads&response_type=token

And change YourClientID to your app ID, this will allow you to get information about your advertising account. Open this link in your browser and you will be redirected to another page, which URL address holds your generated access token.

Access token expires in 86400 seconds or 24 hours. If you want to generate a token with an unlimited lifetime period, just pass scope to the offline parameter. In case if you need to generate a new token – change your password account or terminate all active sessions in security settings.

You will also need your advertising account ID to make API requests. It can be found via this link, just copy it:  https://vk.com/ads?act=settings

Using APIs to collect data
Let’s write a script that would allow us to retrieve information on all user’s ad campaigns: number of impressions, сlicks and costs. The script will pass this data to a DataFrame and send it to Google Docs.

from oauth2client.service_account import ServiceAccountCredentials
from pandas import DataFrame
import requests
import gspread
import time

We have several constant variables: access token, advertising account ID and Vkontakte API Version. Here we are using the most recent API version, which is 5.103.

token = 'fa258683fd418fafcab1fb1d41da4ec6cc62f60e152a63140c130a730829b1e0bc'
version = 5.103
id_rk = 123456789

To get advertising stats you need to use the  ads.getStatistics method and pass your ad campaign ID to it. Since we don’t run any advertisements yet, we’ll use the  ads.getAds method that returns IDs of ads and campaigns.

Learn more about the API methods available for Vkontakte here

Use the requests library to send a request and convert the response to JSON.


campaign_ids = []
ads_ids = []
r = requests.get('https://api.vk.com/method/ads.getAds', params={
    'access_token': token,
    'v': version,
    'account_id': id_rk
})
data = r.json()['response']

We have a familiar list of dictionaries returned, similar to the one we have reviewed in the previous article, “Analysing data on Facebook Ad Campaigns with Redash”.

Fill in the ad_campaign_dict dictionary as follows: specify ad ID as a key, and campaign ID as a value, where this ad belongs to.

ad_campaign_dict = {}
for i in range(len(data)):
    ad_campaign_dict[data[i]['id']] = data[i]['campaign_id']

Having ID for every ad needed we can invoke the  ads.getStatistics method to collect data on the number of impressions, clicks, costs, and dates for a particular ad, so create several empty lists in advance.

ads_campaign_list = []
ads_id_list = []
ads_impressions_list = []
ads_clicks_list = []
ads_spent_list = []
ads_day_start_list = []
ads_day_end_list = []

We need to invoke the getStatistics method for each ad separately, let’s refer to the ad_campaign_dict and iterate our requests. Retrieve all-time data by calling the ‘period’ method with the  ‘overall’ value. Some ads may not have impression or clicks if they haven’t been launched yet, this may cause a  KeyError. Let’s recall to the try — except approach to handle this error.

for ad_id in ad_campaign_dict:
        r = requests.get('https://api.vk.com/method/ads.getStatistics', params={
            'access_token': token,
            'v': version,
            'account_id': id_rk,
            'ids_type': 'ad',
            'ids': ad_id,
            'period': 'overall',
            'date_from': '0',
            'date_to': '0'
        })
        try:
            data_stats = r.json()['response']
            for i in range(len(data_stats)):
                for j in range(len(data_stats[i]['stats'])):
                    ads_impressions_list.append(data_stats[i]['stats'][j]['impressions'])
                    ads_clicks_list.append(data_stats[i]['stats'][j]['clicks'])
                    ads_spent_list.append(data_stats[i]['stats'][j]['spent'])
                    ads_day_start_list.append(data_stats[i]['stats'][j]['day_from'])
                    ads_day_end_list.append(data_stats[i]['stats'][j]['day_to'])
                    ads_id_list.append(data_stats[i]['id'])
                    ads_campaign_list.append(ad_campaign_dict[ad_id])
        except KeyError:
            continue

Now, create a DataFrame and print out the first 5 data points

df = DataFrame()
df['campaign_id'] = ads_campaign_list
df['ad_id'] = ads_id_list
df['impressions'] = ads_impressions_list
df['clicks'] = ads_clicks_list
df['spent'] = ads_spent_list
df['day_start'] = ads_day_start_list
df['day_end'] = ads_day_end_list
print(df.head())

Exporting Data to Google Docs
We’ll need a Google API access token, navigate to https://console.developers.google.com and create one. Choose any name you like, then go to your Dashboard and click “Enable APIs and Services”. Choose Google Drive API from the list, enable it and do exactly the same for Google Sheets API.

After activation you will be redirected to the API control panel. Click Credentials – Create Credentials, click choose data type and create an account. Choosing a role is optional, just proceed and specify JSON as a key type.

After these steps you can download a JSON file with your credentials, we’ll rename it to «credentials.json». On the main page you’ll find the email field – copy your email address.

Go to https://docs.google.com/spreadsheets and create a new file named data, we’ll pass data from our DataFrame to it. Put the  credentials.json file in one directory with the script and continue coding. Add these links to the scope list:

scope = ['https://spreadsheets.google.com/feeds', 'https://www.googleapis.com/auth/drive']

We will use the  ServiceAccountCredentials.from_json_keyfile_name and  gspread.authorize methods available in the  oauth2client and  gspread libraries for authenticaion process. Specify your file name and the scope variable in the ServiceAccountCredentials.from_json_keyfile_name method. The  sheet variable will allow us to send requests to our file in Google Docs.

creds = ServiceAccountCredentials.from_json_keyfile_name('credentials.json', scope)
client = gspread.authorize(creds)
sheet = client.open('data').sheet1

Apply the update_cell method to enter new value in a table cell. It’s worth mentioning that the indexing starts at 0, not 1. With the first loop we’ll move the column names of our DataFrame. And with the following loops we’ll move the rest of our data points. The default limits allow us to make 100 loops for 100 seconds. These restrictions may cause errors and stop our script, that’s why we need to use time.sleep and make the script sleep for 1 second after each loop.

count_of_rows = len(df)
count_of_columns = len(df.columns)
for i in range(count_of_columns):
    sheet.update_cell(1, i + 1, list(df.columns)[i])
for i in range(1, count_of_rows + 1):
    for j in range(count_of_columns):
        sheet.update_cell(i + 1, j + 1, str(df.iloc[i, j]))
        time.sleep(1)

In case of success, you’ll get the same table:

Exporting data to Redash

See how you can connect Google Analytics to Redash in this article «How to connect Google Analytics to Redash?».

Having a table with Google Analytics and ad campaigns from Vkontakte exported we can compare them by writing the following query:

SELECT
    query_50.day_start,
    CASE WHEN ga_source LIKE '%vk%' THEN 'vk.com' END AS source,
    query_50.spent,
    query_50.impressions,
    query_50.clicks,
    SUM(query_49.ga_sessions) AS sessions,
    SUM(query_49.ga_newUsers) AS users
FROM query_49
JOIN query_50
ON query_49.ga_date = query_50.day_start
WHERE query_49.ga_source LIKE '%vk%' AND DATE(query_49.ga_date) BETWEEN '2020-05-16' AND '2020-05-20'
GROUP BY query_49.ga_date, source

ga_source — the traffic source, from which a user was redirected. Use the  CASE method to combine everything that contains “vk” in one column called «vk.com». With the help of JOIN operator we can add the table with the data on ad campaigns, merging by date. Let’s take the day of the last ad campaign and a couple of days after, this will result in the following output:

Takeaways
Now we have a table that reflects how much were spent in ad costs on a certain day, the number of users who viewed this ad, were engaged and redirected to our website, and then completed the sign-up process.

 No comments    599   2020   Analytics engineering   BI-tools   data analytics   longread
Earlier Ctrl + ↓