


Animating sports data in Tableau
⏱ Время чтения текста – 4 минутыPreviously we shared how to visualize your sports data from the SwingVision app in Tableau , using custom background and shapes. This time we are going to animate our dashboard to watch how landing locations of tennis shots changed over the match. Such an animation can be exported into a video file for later use. That’s what our result looked like in Tableau earlier:
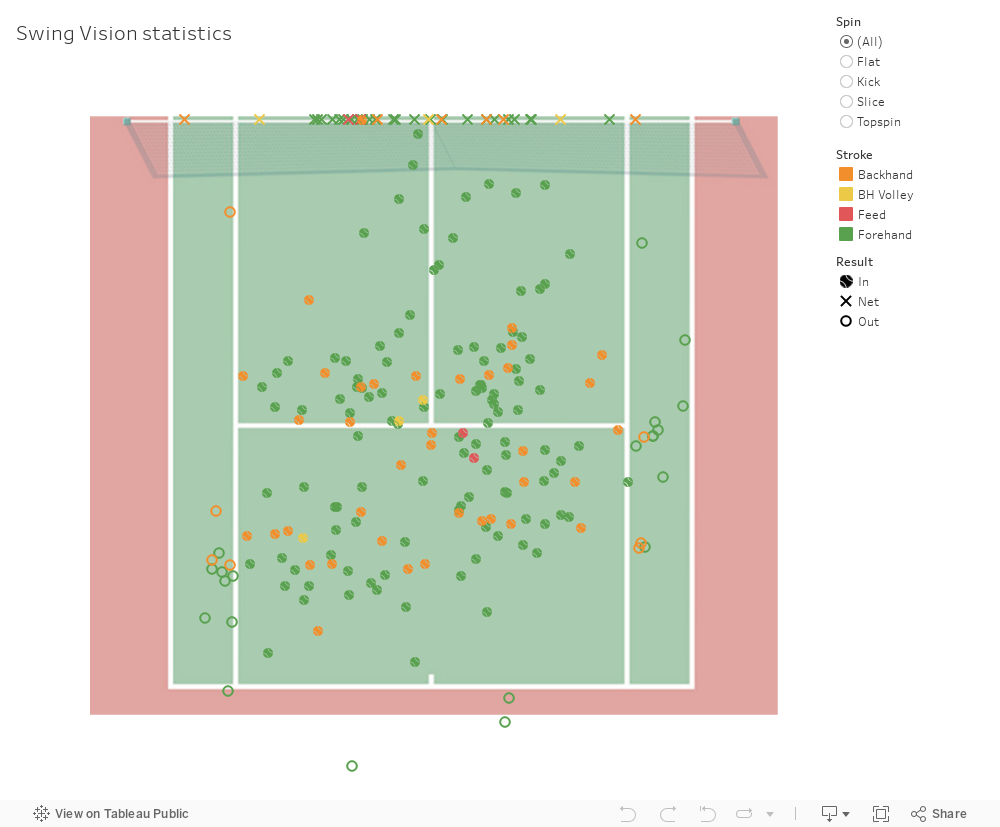
The chart shows landing coordinates of tennis shots on the court. Forehand shots are marked in red, backhands are in orange, the x marks for shots went into the net. We can also use filtering and get expanded tooltip info on hover.
Tableau enables us to create pages to flip through members of a field, changing and animating the analysis. In this case, all we need to is simply drag-and-drop the Shots table to the Pages shelf and click on the Play button.

Let’s switch to the dashboard and try adding the Pages shelf, just click on Worksheet -> Show cards and apply to the current page.

Next, create a new vertical container, drag the panel and minimize the view:

Now after clicking on the Play button, the first part is done:

If you’re a macOS user, it won’t be a problem to make a video from this animation by pressing ⌘ + Shift + 5 and choosing a specific part of your screen. In other cases, you may need to download third-party software for screen recording.