


Bubble charts basics: area vs radius
⏱ Время чтения текста – 5 минутData visualization is a skill used in any industry where data is present, because tables are only good for storing information. When there is a need to present data, or rather certain conclusions derived from them, the data must be presented on graphs of a suitable type. So, here you are faced with two tasks: the first is to choose the right type of graph, the second is to display the results in a plausible way. Today we will tell you about one mistake that designers sometimes make when visualizing data on bubble-charts and how this mistake can be avoided.
The crux of building a bubble-chart
Firstly, let us tell you a bit of boring theory before we start analyzing the data. Bubble-chart is a convenient way to show three numerical variables without building a 3D model. The usual X and Y axes indicate the values of two parameters, and the third is shown by the size of the circle that corresponds to each observation. This is what makes it possible to avoid the need to build a complex 3D chart, that is, anyone who sees a bubble-chart will be able to draw conclusions about the data much faster.
A mistake that a designer, but not a data analyst, can make
With the metrics that are displayed on the axes of the graph, no questions arise. This is the usual way of visualizing data, but with the data shown by the size of the circles there is some difficulty: how to correctly and accurately display changes in the values of a variable, if the control is not a point on the axis, but the size of this point?
The fact is that when building such a graph without using analytical tools, for example, in a graphics editor, the author can draw circles, taking the radius of the circle as its size. At first glance, everything seems to be absolutely correct – the larger the value of the variable, the larger the radius of the circle. However, in this case, the area of the circle will increase not as a linear, but as a power function, because S = π × r2. For instance, the figure below shows that if you double the radius of a circle, the area will quadruple.
Draw a circle in Matplotlib
fig = plt.figure (figsize = (10, 10))
ax = fig.add_subplot (1, 1, 1)
s = 4 * 10e3


ax.scatter (100, 100, s = s, c = 'r')
ax.scatter (100, 100, s = s / 4, c = 'b')
ax.scatter (100, 100, s = 10, c = 'g')
plt.axvline (99, c = 'black')
plt.axvline (101, c = 'black')
plt.axvline (98, c = 'black')
plt.axvline (102, c = 'black')


ax.set_xticks (np.arange (95, 106, 1))
ax.grid (alpha = 1)

plt.show ()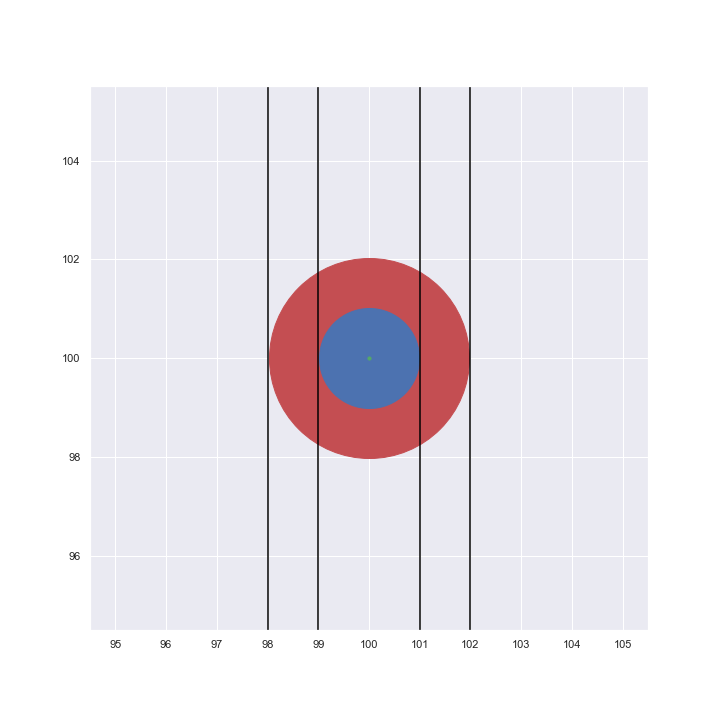
This means that the graph will look implausible, because the dimensions will not reflect the real change in the variable, and the viewer pays attention and compares exactly the area of the circles on the graph.
How to build such a graph correctly?
Fortunately, if you build bubble-charts using Python libraries (Matplotlib and Seaborn), then the size of the circle will be determined by the area, which is absolutely correct from in terms of visualization.
Now, using the example of real data found on Kaggle, we will show how to build a bubble-chart. The data contains the following variables: country, population size, percentage of literate population. For the chart to be readable, let’s take a subsample of the top 10 countries after sorting all the data in order of increasing GDP.
First, let’s load all the necessary libraries:
import pandas as pd
import matplotlib.pyplot as plt
import seaborn as sns
Then, load the data, clear it from all rows with missing values and transform the population of countries to millions of people:
data = pd.read_csv ('countries of the world.csv', sep = ',')
data = data.dropna ()
data = data.sort_values (by = 'Population', ascending = False)
data = data.head (10)
data ['Population'] = data ['Population']. apply (lambda x: x / 1000000)Now that all the preparations are complete, you can build a bubble-chart:
sns.set (style = "darkgrid")
fig, ax = plt.subplots (figsize = (10, 10))
g = sns.scatterplot (data = data, x = "Literacy (%)", y = "GDP ($ per capita)", size = "Population", sizes = (10,1500), alpha = 0.5)
plt.xlabel ("Literacy (Percentage of literate citizens)")
plt.ylabel ("GDP per Capita")
plt.title ('Chart with bubbles as area', fontdict = {'fontsize': 'x-large'})

def label_point (x, y, val, ax):
    a = pd.concat ({'x': x, 'y': y, 'val': val}, axis = 1)
    for i, point in a.iterrows ():
        ax.text (point ['x'], point ['y'] + 500, str (point ['val']))

label_point (data ['Literacy (%)'], data ['GDP ($ per capita)'], data ['Country'], plt.gca ())

ax.legend (loc = 'upper left', fontsize = 'medium', title = 'Population (in mln)', title_fontsize = 'large', labelspacing = 1)

plt.show ()
This graph displays three metrics in an understandable way: the level of GDP per capita on the Y axis, the percentage of the literate population on the X axis, and the population – by the area of the circle.
We recommend using size of the circle to show one of the variables, if there is a need to show 3 or more variables on one chart.