


Pandas Profiling in action: reviewing a new EDA library on Superstore Sales dataset
⏱ Время чтения текста – 8 минутBefore moving directly to data analysis we need to understand what type of data we are going to work with. In today’s material, we will take a closer look at the SuperStore Sales dataset, specifically at the Orders column. It includes customer shopping data of a Canadian online supermarket, such as order, product and customer ids, type of shipping, prices, product categories, names and etc. You can find more information about this dataset on GitHub. After creating a pandas DataFrame we can simply use the describe() method to get a sense of our data.
import pandas as pd

df = pd.read_csv('superstore_sales_orders.csv', decimal=',')
df.describe(include='all')
And oftentimes it leads to such a mess:

The source code of this library is available on GitHub
If we spend some time trying to get a grasp of this descriptive table, we can find out that customers are more likely to choose “Regular air” as a shipping type or that the majority of orders were made from Ontario. Nevertheless, there is a better tool to describe the dataset in more detail – the pandas-profiling library. Just pass a DataFrame to it and we will get a generated HTML page with a detailed description of our dataset:
import pandas_profiling
profile = pandas_profiling.ProfileReport(df)
profile.to_file("output.html")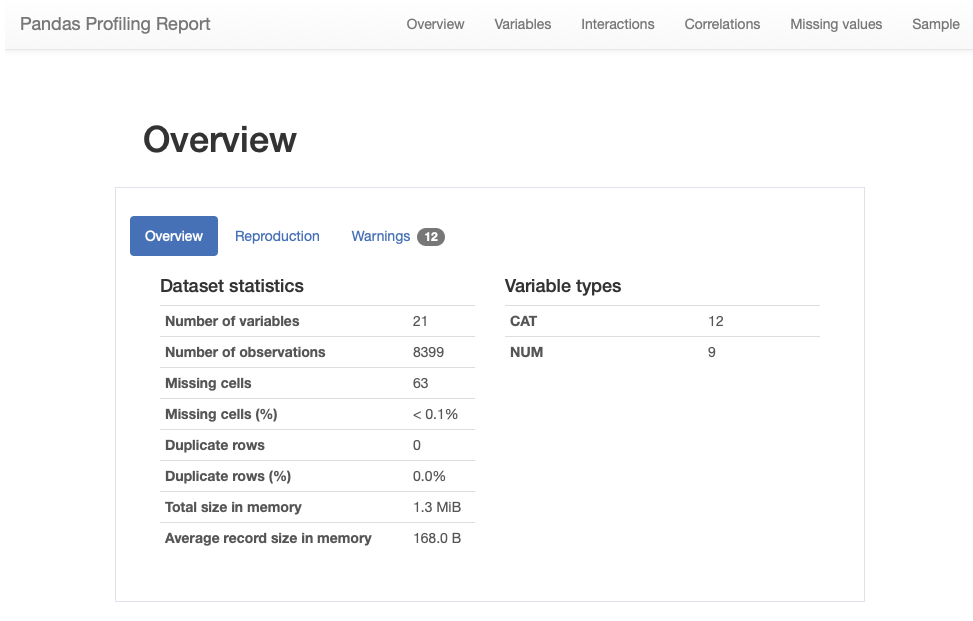
As you see, it returned a page with 6 sections, namely: overview, variables, interactions and correlations, number of missing values, and dataset samples.
View a full version of the Pandas Profiling Report
Data overview
Let’s move to the first subsection called “Overview”. Pandas Profiling provided the following stats: number of variables, number of observations, missing cells, duplicates, and file size. The Variable types column shows that our DataFrame consists of 12 categorical and 9 numerical variables.

The “Reproduction” subsection stores technical information, showing how long it took to analyze the dataset, currently installed version , configuration info and etc.

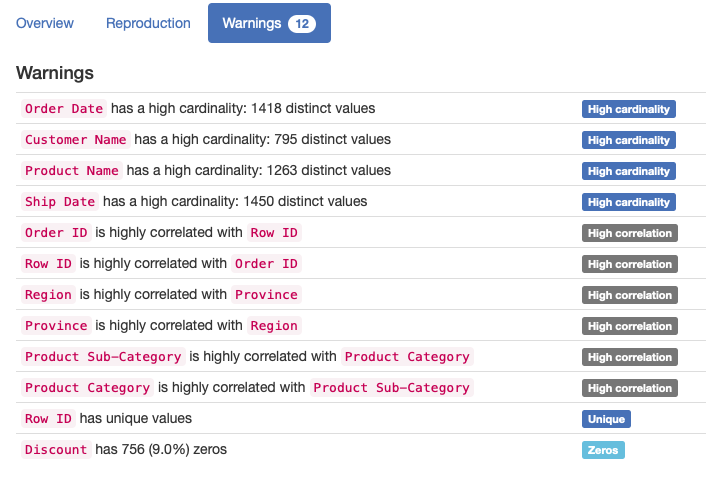
The “Warnings” subsection informs about possible issues in the dataset structure. Now, it warns us that the “Order Date” column has too many distinct values.
Variables
Moving further, this subsection contains a detailed description of each variable, displaying the number of duplicates and missing values stored, memory size, maximum and minimal values. Right next to the stats you can see the distribution of column values.
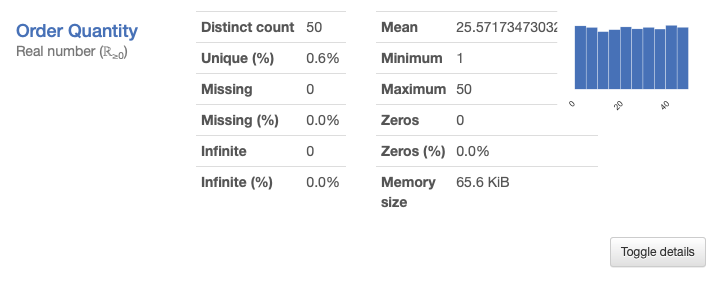
Clicking on Toggle details you will see more expanded information: quartiles, median and other useful descriptive statistical indicators. The remaining tabs contain a histogram displayed on the main screen, top 10 frequent values and extremes.

Interactions
This section displays how variables are interconnected on a hexbin plot: The graph looks not very obvious and clear, since the legend is lacking.

Correlations
The section represents correlations between variables calculated in a variety of ways. For example, the first tab shows Pearson’s r-value. It is noticeable that Profit is positively correlated with Sales. You can get a detailed explanation to each coefficient by clicking on the Toggle correlation descriptions button.

Missing values
This section includes a bar chart, matrix, and dendrogram with the number of fields in each variable. For instance, the Product Base Margin column is missing three values.

Samples
And the final section show the first and last 10 rows as chunks of a dataset, pretty similar to the head() method in Pandas.

Key Takeaways
The library is definitely more focused on statistics than Pandas, one can get useful descriptive stats for each variable and see their correlation. It provides a comprehensive report on a dataset in a user-friendly way, allowing to undertake an initial investigation and get a sense of data.
Still, the library has its shortfalls. If your dataset is fairly large the report generation time may be extended up to several hours. It’s a great tool for automating EDA tasks, however, it can’t do all the work for you and some details may be overlooked. If you are just getting started with data analysis, we would highly recommend to start it with pandas. It will solidify your knowledge and boost confidence in working with data.