


Collecting data from hypermarket receipts on Python
⏱ Время чтения текста – 6 минутRecently, once again buying products in a hypermarket, I recalled that, according to the Russian Federal Act FZ-54, any trade operator, that issues a receipt, is obliged to send the data thereof to the Tax Service.
So, what does it mean for us, data analysts? It means that we can know ourselves and our needs better, and also acquire interesting data on own purchases.
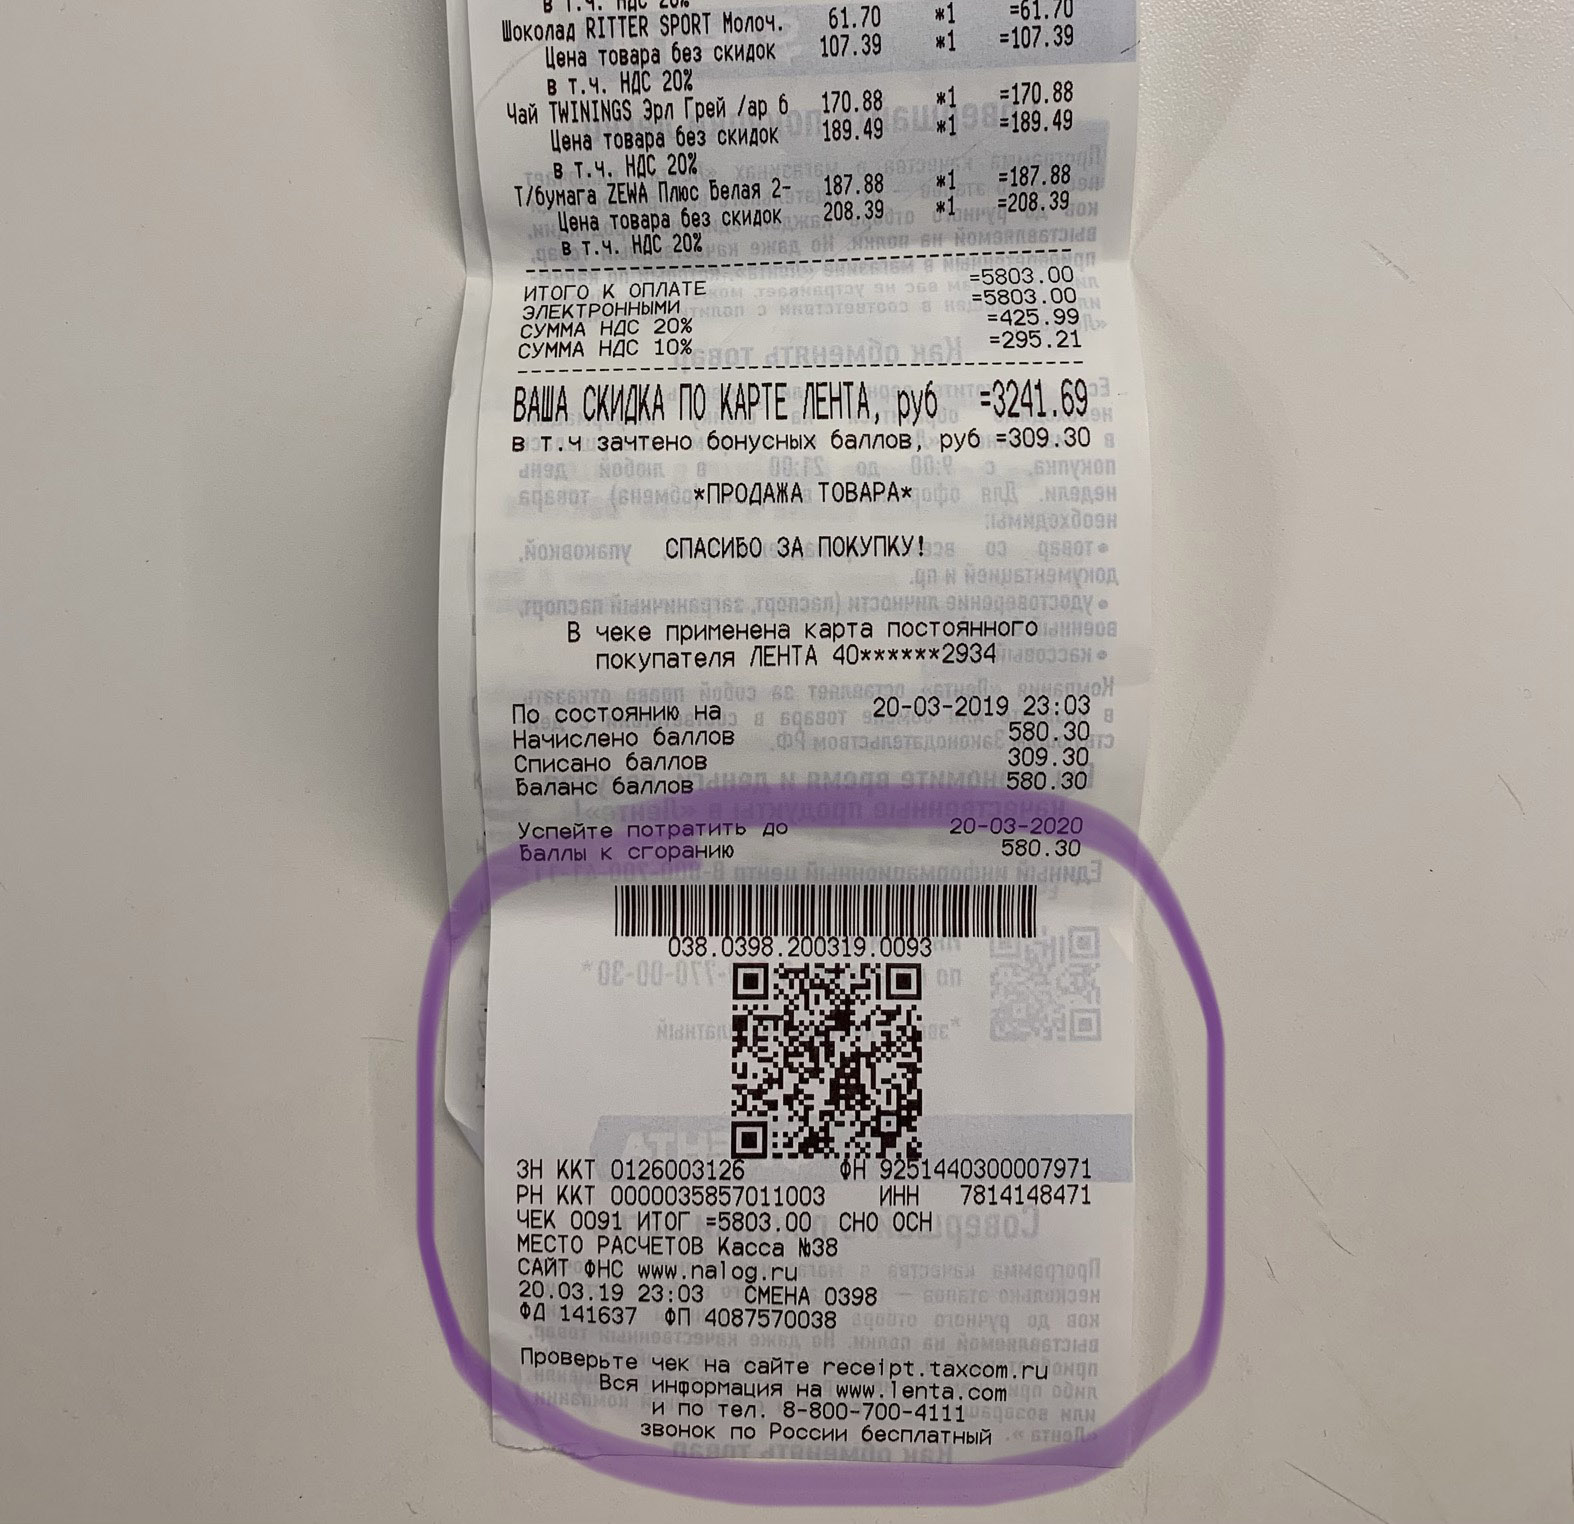
Let’s try to assemble a small prototype of an app that will allow to make a dynamic of our purchases within the framework of blog posts’ series. So, we’ll start from the fact, that each receipt has a QR-code, and if you identify it, you’ll receive the following line:
t=20190320T2303&s=5803.00&fn=9251440300007971&i=141637&fp=4087570038&n=1
This line comprises:
t – timestamp, the time when you made a purchase
s – sum of the receipt
fn – code number of fss, will be needed further in a request to API
i – receipt number, will be needed further in a request to API
fp – fiscalsign parameter, will be needed further in a request to API
Within the solution of the first step, we will parse the receipt data and collect it in pandas dataframe, using Python modules.
We will use API, that provides data on the receipt from the Tax Service website.
Initially, we will receive authentication data:
import requests
your_phone = '+7XXXYYYZZZZ' #you need to state your phone number, SMS with password will arrive thereon
r = requests.post('https://proverkacheka.nalog.ru:9999/v1/mobile/users/signup', json = {"email":"email@email.com","name":"USERNAME","phone":your_phone})
As a result of performing POST request we receive a password in SMS to the indicated phone number. Further on, we will be using it in a variable pwd
Now we’ll parse our line with values from QR-code:
import re
qr_string='t=20190320T2303&s=5803.00&fn=9251440300007971&i=141637&fp=4087570038&n=1'
t=re.findall(r't=(\w+)', qr_string)[0]
s=re.findall(r's=(\w+)', qr_string)[0]
fn=re.findall(r'fn=(\w+)', qr_string)[0]
i=re.findall(r'i=(\w+)', qr_string)[0]
fp=re.findall(r'fp=(\w+)', qr_string)[0]
We’ll use the variables obtained in order to extract the data.
One Habr post pretty thoroughly examines status of errors at formation of API request, therefore I won’t repeat this information.
In the beginning, we need to verify the presence of data on this receipt, so we form a GET request.
headers = {'Device-Id':'', 'Device-OS':''}
payload = {'fiscalSign': fp, 'date': t,'sum':s}
check_request=requests.get('https://proverkacheka.nalog.ru:9999/v1/ofds/*/inns/*/fss/'+fn+'/operations/1/tickets/'+i,params=payload, headers=headers,auth=(your_phone, pwd))
print(check_request.status_code)
In the request one needs to indicate headers, at least empty ones. In my case, GET request returns error 406, thus I get that such receipt is found (why GET request returns 406 remains a mystery to me, so I will be glad to receive some clues in comments). If not indicating sum or date, GET request returns error 400 – bad request.
Let’s move on to the most interesting part, receiving data of the receipt:
request_info=requests.get('https://proverkacheka.nalog.ru:9999/v1/inns/*/kkts/*/fss/'+fn+'/tickets/'+i+'?fiscalSign='+fp+'&sendToEmail=no',headers=headers,auth=(your_phone, pwd))
print(request_info.status_code)
products=request_info.json()
We should receive code 200 (successful execution of the request), and in the variable products – everything, that applies to our receipt.
In order to further work with this data, let’s use pandas and transform everything in dataframe.
import pandas as pd
from datetime import datetime
my_products=pd.DataFrame(products['document']['receipt']['items'])
my_products['price']=my_products['price']/100
my_products['sum']=my_products['sum']/100
datetime_check = datetime.strptime(t, '%Y%m%dT%H%M') #((https://docs.python.org/3/library/datetime.html#strftime-and-strptime-behavior formate the date))
my_products['date']=datetime_check
my_products.set_index('date',inplace=True)
Now we have working pandas.dataframe with receipts, visually it looks as follows:

You can construct a bar chart of purchases or observe everything as a box plot:
import matplotlib.pyplot as plt
%matplotlib inline
my_products['sum'].plot(kind='hist', bins=20)
plt.show()
my_products['sum'].plot(kind='box')
plt.show()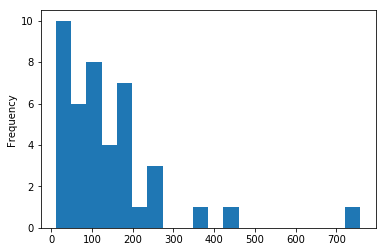
In conclusion, we will simply get descriptive statistics as text, using a command .describe():
my_products.describe()
It’s convenient to write down data as .csv file, so that the next time you can amend the statistics:
with open('hyper_receipts.csv', 'a') as f:
             my_products.to_csv(f, header=True)