Later Ctrl + ↑

Cohort analysis in Redash

Время чтения текста – 5 минут

In one of the previous articles we have reviewed building of Retention-report and have partially addressed the concept of cohorts therein.
Cohort usually implies group of users of a product or a company. Most often, groups are allocated on the basis of time of app installation / appearance of a user in a system.
It turns out, that, using cohort analysis, one can track down how the changes in a product affected the behaviour of users (for example, of old and new users).

Along with that, cohorts can be defined also proceeding from other parameters: geography of a user, traffic source, device platform and other important parameters of your product.

We will figure out, how to compare Retention of users of weekly cohorts in Redash, since Redash has special type of visualization for building such type of report.
Firstly, let’s sort out SQL-query. We still have two tables – user (id of a user and time of app installation) and client_session – timestamps (created_at) of activity of each user (user_id). Let’s consider the Retention of the first seven days for last 60 days.
The query is written in Cloudera Impala, let’s review it.

For starters, let’s build the total size of cohorts:

select trunc(from_unixtime(user.installed_at), "WW") AS cohort_week, 
	ndv(distinct user.id) as cohort_size //counting the number of users in the cohort
	from user 
	where from_unixtime(user.installed_at) between date_add(now(), -60) and now() //taking registered users for last 60 days
group by trunc(from_unixtime(user.installed_at), "WW")

The second part of the query can calculate the quantity of active users for every day during the first thirty days:

select trunc(from_unixtime(user.installed_at), "WW") AS cohort_week, 
        datediff(cast(cs.created_at as timestamp),cast(user.installed_at as timestamp)) as days,
	ndv(distinct user.id) as value  //counting the number of active users for every day
		from user 
		left join client_session cs on user.id=cs.user_id
where from_unixtime(user.installed_at) between date_add(now(), -60) and now()
and from_unixtime(cs.created_at) >= date_add(now(), -60) //taking sessions for last 60 days
and datediff(cast(cs.created_at as timestamp),cast(user.installed_at as timestamp)) between 0 and 30 //cutting off only the first 30 days of activity
group by 1,2

Bottom line, all the query entirely:

select size.cohort_week, size.cohort_size, ret.days, ret.value from
(select trunc(from_unixtime(user.installed_at), "WW") AS cohort_week, 
		ndv(distinct user.id) as cohort_size 
	from user 
	where from_unixtime(user.installed_at) between date_add(now(), -60) and now()
group by trunc(from_unixtime(user.installed_at), "WW")) size
left join (select trunc(from_unixtime(user.installed_at), "WW") AS cohort_week, 
        datediff(cast(cs.created_at as timestamp),cast(user.installed_at as timestamp)) as days,
		ndv(distinct user.id) as value 
		from user 
		left join client_session cs on user.id=cs.user_id
where from_unixtime(user.installed_at) between date_add(now(), -60) and now()
and from_unixtime(cs.created_at) >= date_add(now(), -60)
and datediff(cast(cs.created_at as timestamp),cast(user.installed_at as timestamp)) between 0 and 30
group by 1,2) ret on size.cohort_week=ret.cohort_week

Great, now correctly calculated data is available to us.

Data of cohorts in tabular form

Let’s create new visualization in Redash and indicate the parameters correctly:
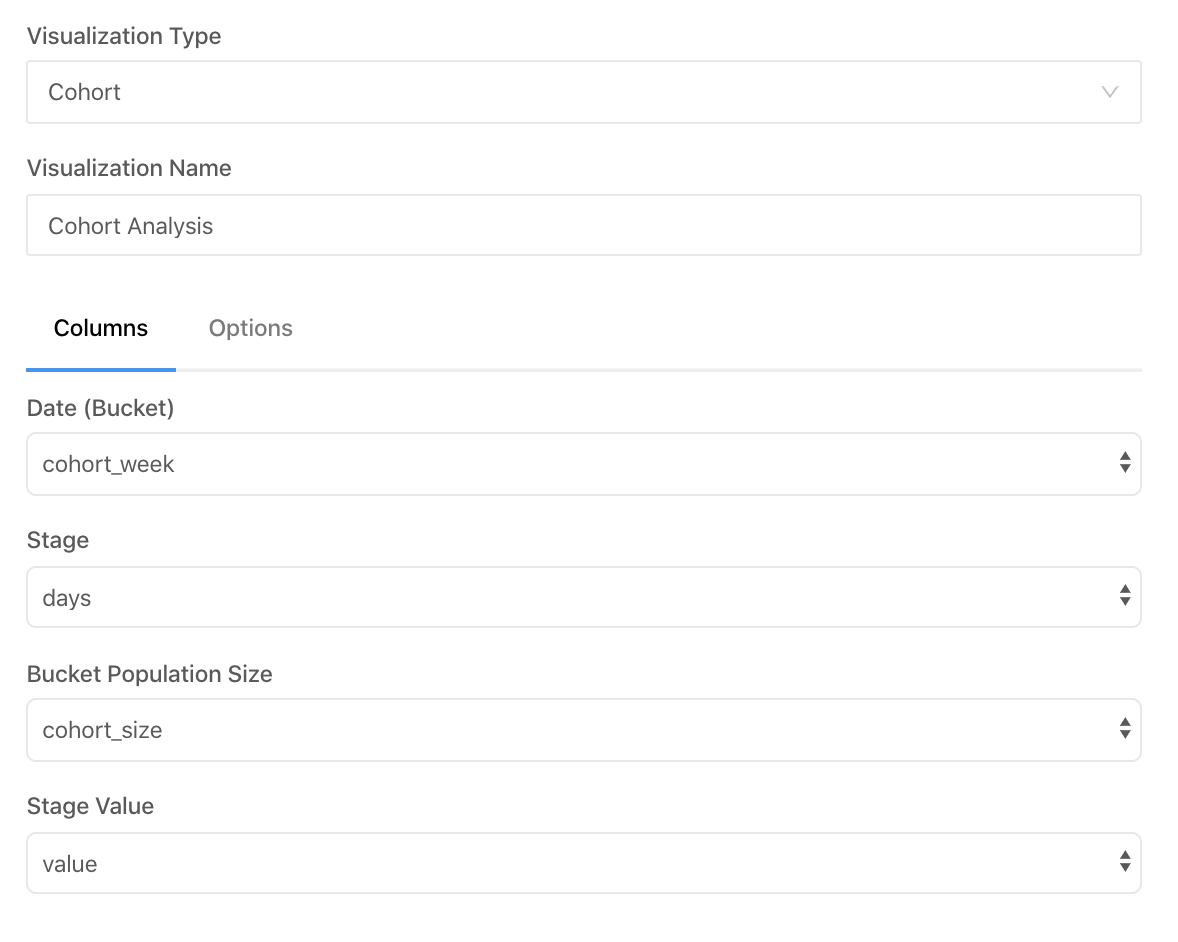
It’s important to indicate the parameters correctly – the columns of the resulting query are compliant therewith.

Let’s make sure to indicate that we have weekly cohorts:

Voila, our visualization of cohorts is ready:

You can add filters and parameters to it and use in a dashboard

Materials on the topic

 No comments    3483   2020   BI-tools   redash   sql   visualisation

Using parameters in Redash

Время чтения текста – 2 минуты

The most convenient and useful thing in Redash is parameters. Parameters can be both in a report and in dashboards.
Parameter – is an element of the interface, controlled by a user producing a report.

Parameter in a report can be of the following types:

Each type explained separately:

  • Text – text input field, can be used in constructions of LIKE type, such parameter can’t be applied in public dashboards
  • Number – number, entered by a user
  • Dropdown list – list of values, from which a user can select just one or several values (not long ago, an option of multi-entry of parameters in a dropdown list appeared)
  • Query dropdown list – similarly to the previous one, however the values will be taken from the existing query results
  • Date / Date and Time / Date and Time (with seconds) – fields of date entry
  • Date Range / Date and Time Range / Date and Time Range (with seconds) – fields of date ranges entry.
    It’s convenient to use for the following construction
between '{{parameter.start}}' and '{{parameter.end}}'

In case of dashboard, a situation might arise, when a parameter is named the same way in several queries, then it will become common for all the dashboard, it’s handy.

One of not obvious, but rather useful solutions: how to make a parameter disabled?
Let’s assume, that parameter of “dropdown list” type is named parameter and we want to set it for a column geo of a table, then the code of the query will look approximately like that:

WHERE
    ('{{parameter}}' = 'Disabled' or geo = '{{parameter}}')

At that, surely, ‘Disabled’ should be added to the values of the dropdown list.

 No comments    4168   2020   BI-tools   parameter   redash

Looker Overview

Время чтения текста – 10 минут

Today we are going to talk about BI-platform Looker, on which I managed to work in 2019.

Here is the short content of the article for convenient and fast navigation:

  1. What is Looker?
  2. Which DBMS you can connect to via Looker and how?
  3. Building of Looker ML data model
  4. Explore Mode (data research on the model built)
  5. Building of reports and their saving in Look
  6. Examples of dashboards in Looker

What is Looker?

Creators of Looker position it as a software of business intelligence class and big data analytics platform, that helps to research, analyze and share business analytics in real time mode.
Looker — is a really convenient tool and one of a few BI products, that allows to work with pre-set data cubes in a real-time mode (actually, relational tables that are described in Look ML-model).
An engineer, working with Looker, needs to describe a data model on Look ML language (it’s something between CSS and SQL), publish this data model and then set reporting and dashboards.
Look ML itself is pretty simple, the nexus between the data objects are set by a data-engineer, which consequently allows to use the data without knowledge of SQL language (to be precise: Looker engine generates the code in SQL language itself on user’s behalf).

Just recently, in June 2019, Google announced acquisition of Looker platform for $2.6 billion.

Which DBMS you can connect to via Looker and how?

The selection of DBMS that Looker is working with is pretty wide. You can see the various connections on the screen shot below as of October, 2019:

Available DBMS for connection

You can easily set a connection to the database via web-interface:

Web-interface of connection to DBMS

With regard to connections to databases, I’d like to highlight the following two facts: first of all, unfortunately, Clickhouse support from Yandex is currently missing (as well as in the foreseeable future). Most likely, the support won’t appear, considering the fact that Looker was acquired by a competitor, Google.
updated: Actually, Looker supports Clickhouse from the December 2019
The second nuisance is that you can’t build one data model, that would apply to different DBMS. There is no inbuilt storage in Looker, that could combine the results of query (unlike the same Redash).
It means, that analytical architecture should be built within one DBMS (preferably with high action speed or on aggregated data).

Building of Looker ML data model

In order to build a report or a dashboard in Looker, you need to provisionally set a data model. Syntax of Look ML language is quite thoroughly described in the documentation. Personally, I can just add that model description doesn’t require long-time immersion for a specialist with SQL knowledge. Rather, one needs to rearrange the approach to data model preparation. Look ML language is very much alike CSS:

Console of Look ML model creation

In the data model the following is set up: links with tables, keys, granularity, information of some fields being facts, and other – measurements. For facts, the aggregation is written. Obviously, at model creation one can use various IF / CASE expressions.

Explore mode

Probably, it’s the main killer-feature of Looker, since it allows any business departments to get data without attraction of analysts / data engineers. And, guess that’s why use of accounts with Explore mode is billed separately.

In fact, Explore mode is an interface, that allows to use the set up Look ML data model, select the required metrics and measurements and build customized report / visualization.
For example, we want to understand how many actions of any kind were performed in Looker’s interface last week. In order to do it, using Explore mode, we select Date field and apply a filter to it: last week (in this sense, Looker is quite smart and it and it will be enough writing ‘Last week’ in the filter), thereafter we choose “Category” from the measurements, and Quantity as a metric. After pressing the button Run the ready report will be generated.

Building report in Looker

Then, using the data received in the table form, you can set up the visualization of any type.
For example, Pie chart:

Applying visualization to report

Building of reports and their saving in Look

Sometimes you can have a desire to save the set of data / visualization received in Explore and share it with colleagues, for this purpose Looker has a separate essense – Look. That is ready constructed report with selected filters / measurements / facts.

Example of the saved Look

Examples of dashboards in Looker

Systemizing the warehouse of Look created, oftentimes you want to receive a ready composition / overview of key metrics, that could be displayed on one list.
For these purposes dashboard creation fits perfectly. Dashboard is created either on the wing, or using previously created Look. One of the dashboard’s “tricks” is configuration of parameters, that are changed on all the dashboard and can be applied to all the Look at the same time.

Interesting features in one line

  • In Looker you can refer to other reports and, using such function, you can create a dynamic parameter, that is passed on by a link.
    For example, you’ve created a report with division of revenue by countries, and in this report you can refer to the dashboard on a separate country. Following the link, a user sees the dashboard on a specific country, that he clicked on.
  • On every Looker page there is a chat, where support service answers very promptly
  • Looker is not able to work with data merge on the level of various DBMS, however it can combine the data on the level of ready Look (in our case, this function works really weird).
  • Within the framework of work with various models, I have found out an extremely non-trivial use of SQL for calculation of unique values in a non-normalized data table, Looker calls it symmetric aggregates.
    SQL, indeed, looks very non-trivial:
SELECT 
 order_items.order_id AS "order_items.order_id",
 order_items.sale_price AS "order_items.sale_price",
 (COALESCE(CAST( ( SUM(DISTINCT (CAST(FLOOR(COALESCE(users.age ,0)
 *(1000000*1.0)) AS DECIMAL(38,0))) + 
 CAST(STRTOL(LEFT(MD5(CONVERT(VARCHAR,users.id )),15),16) AS DECIMAL(38,0))
 * 1.0e8 + CAST(STRTOL(RIGHT(MD5(CONVERT(VARCHAR,users.id )),15),16) AS DECIMAL(38,0)) ) 
 - SUM(DISTINCT CAST(STRTOL(LEFT(MD5(CONVERT(VARCHAR,users.id )),15),16) AS DECIMAL(38,0))
 * 1.0e8 + CAST(STRTOL(RIGHT(MD5(CONVERT(VARCHAR,users.id )),15),16) AS DECIMAL(38,0))) ) 
 AS DOUBLE PRECISION) 
 / CAST((1000000*1.0) AS DOUBLE PRECISION), 0) 
 / NULLIF(COUNT(DISTINCT CASE WHEN users.age IS NOT NULL THEN users.id 
 ELSE NULL END), 0)) AS "users.average_age"
FROM order_items AS order_items
LEFT JOIN users AS users ON order_items.user_id = users.id

GROUP BY 1,2
ORDER BY 3 DESC
LIMIT 500
  • At implementation of Looker to a purchase, JumpStart Kit is mandatory, which costs not less than $6k. Within this kit you receive support and consultation from Looker at tool implementation.
 No comments    1065   2020   analysis   Analytics engineering   BI-tools   looker   sql

Setting up alerts in Redash

Время чтения текста – 5 минут

A very handy function on alert building is implemented in Redash. Alerts stand for notifications, arising at adjustment of some specific indicator. At that, the degree of change is set manually by a user on his own in the interface. Alerts can be set to a mail or to a channel / direct messages Slack.

Let’s recall how to collect the data, using Google Analytics, and set up alerts for this data, applying the internal Redash database (query-results). As a foundation for an alert we will focus on the reduction of number of users on the site for the previous day by more than 30%.

Building a query to Google Analytics

{
    "ids": "ga:128886640",
    "start_date": "30daysAgo",
    "end_date": "yesterday",
    "metrics": "ga:users", 
    "dimensions": "ga:date"
}

As a result of performance of this query, we will receive a number of users for the last 30 days.

Turning on the storage of query results

One of the main features of redash is an opportunity of calling upon the results of query performance, that are stored in the internal DBMS SQLite.
In order to turn on the storage of results, we need to go to Data Sources and turn on query-results (beta).

And now, with a simple command presented below:

select * from query_37

we will receive a result, similar to the one of the previous query to GA, however this one has an opportunity of using SQL language for processing of the data set obtained.

Building a query for evaluation of changes within the number of users

In order to set up the alert, first of all we need to write a query, that will eventually provide us with a target indicator for check, in our case it is growth or reduction in the number of users on the website.
Lets write a query, calling upon the internal DBMS of Redash:

SELECT sum(CASE WHEN date(ga_date)=DATE('now', '-1 day') THEN ga_users ELSE NULL END) AS yesterday,
sum(CASE WHEN date(ga_date)=DATE('now', '-2 day') THEN ga_users ELSE NULL END) AS before_yesterday,
(sum(CASE WHEN date(ga_date)=DATE('now', '-1 day') THEN ga_users ELSE NULL END)*1.0/
sum(CASE WHEN date(ga_date)=DATE('now', '-2 day') THEN ga_users ELSE NULL END)*1.0-1)*100 AS difference
FROM query_37

In the above-shown query we are calculating the number of users for two previous days, and also evaluating the change of number of users in percentage.
In the current example, we have received the following table of data, that we will use further at the process of alert setting:

Now, in order for us to be able to receive alerts, we need to set query performance by schedule (regular update of results / scheduled query in redash terminology).

We set an update for 10 o’clock of every morning:

Setting alert

Going to the menu Create – Alert. Inserting the name of query, in my case it is “Alert on users”.
Hereafter, we can change the reflected name of notification or leave the one, proposed by the system.

Choosing a target metric within the example reviewed – difference. Below, in the comparison operator (Op) selecting less then and setting a value of -30.

In the block on the right you need to select where exactly the alert will be sent. You can read about the setting of alert’s path more thoroughly on the official website of Redash.

Now, the alert has appeared on the page with the list of alerts and is by default in the status OK.

As soon as the indicator exceeds the level that we’ve set, the status will change to TRIGGERED, and the alert will be sent to mail / to Slack.

More on the topic

 No comments    1685   2019   alert   BI-tools   redash

Updates in Redash v8

Время чтения текста – 5 минут

Two weeks ago the final release of Redash edition 8 took place. The complete list of improvements can be found on the page of beta version of v8 release.

In my overview of the novelties, I will focus my attention only on those, that have the most significant impact on user’s experience of Redash utilization, i.e. that are more illustrative for you and me:

  • Support for multi-select in dropdown (and query dropdown) parameters.
  • Support for dynamic values in date and date-range parameters.
  • Search dropdown parameter values.
  • Pivot Table: support hiding totals.
  • New Visualization: Details View.

Support for multi-select in dropdown (and query dropdown) parameters.

In the 8th version of Redash we finally receive the long-awaited support of selection of several values in a parameter such as “dropdown list” or “dropdown list on the basis of the query”:

When we select several different clues, the above-mentioned values transform into a list, divided by a comma. At that, there is an opportunity to wrap the values of such a list into single quotes or double quotes.

For us it means an opportunity to use requirements of IN type with a parameter in the queries:

At application of such parameter values, we will receive the following URL in the line of the browser:

Support for dynamic values in date and date-range parameters.

Extremely handy and useful feature for selection of dates, that is often used in Tableau, however hadn’t been implemented into Redash until recently: utilization of dynamic values for dates:

Pressing the zipper button, you can select a random period, and Redash will insert the required values into the query on its own. Thus, for instance, you can quickly look through the statistics for last week or last month.

Search dropdown parameter values.

Let’s assume that we are using a parameter of a type “dropdown list on the basis of the query”, and in the query selected there are more than 300 resulting lines, based on which we need to find a value of our interest. In the 8th version this problem is solved by auto-complete and search by parameter values. In the example below I am inserting a line “Orga” and obtain all the values, in which this line is met, very convenient.

Pivot Table: support hiding totals.

Quite long-awaited feature, that allows to aggregate outcomes by rows / columns.

New Visualization: Details View

New presentation of data results: view of details by each line. I assume, it can be convenient at use in a dashboard, when you apply filtration by a specific user / partner.
It visualizes the names of columns and results of a specific line in a table form.

 No comments    720   2019   BI-tools   redash   visualisation
Earlier Ctrl + ↓