Later Ctrl + ↑

How to build a dashboard with Bootstrap 4 from scratch (Part 2)

Время чтения текста – 12 минут

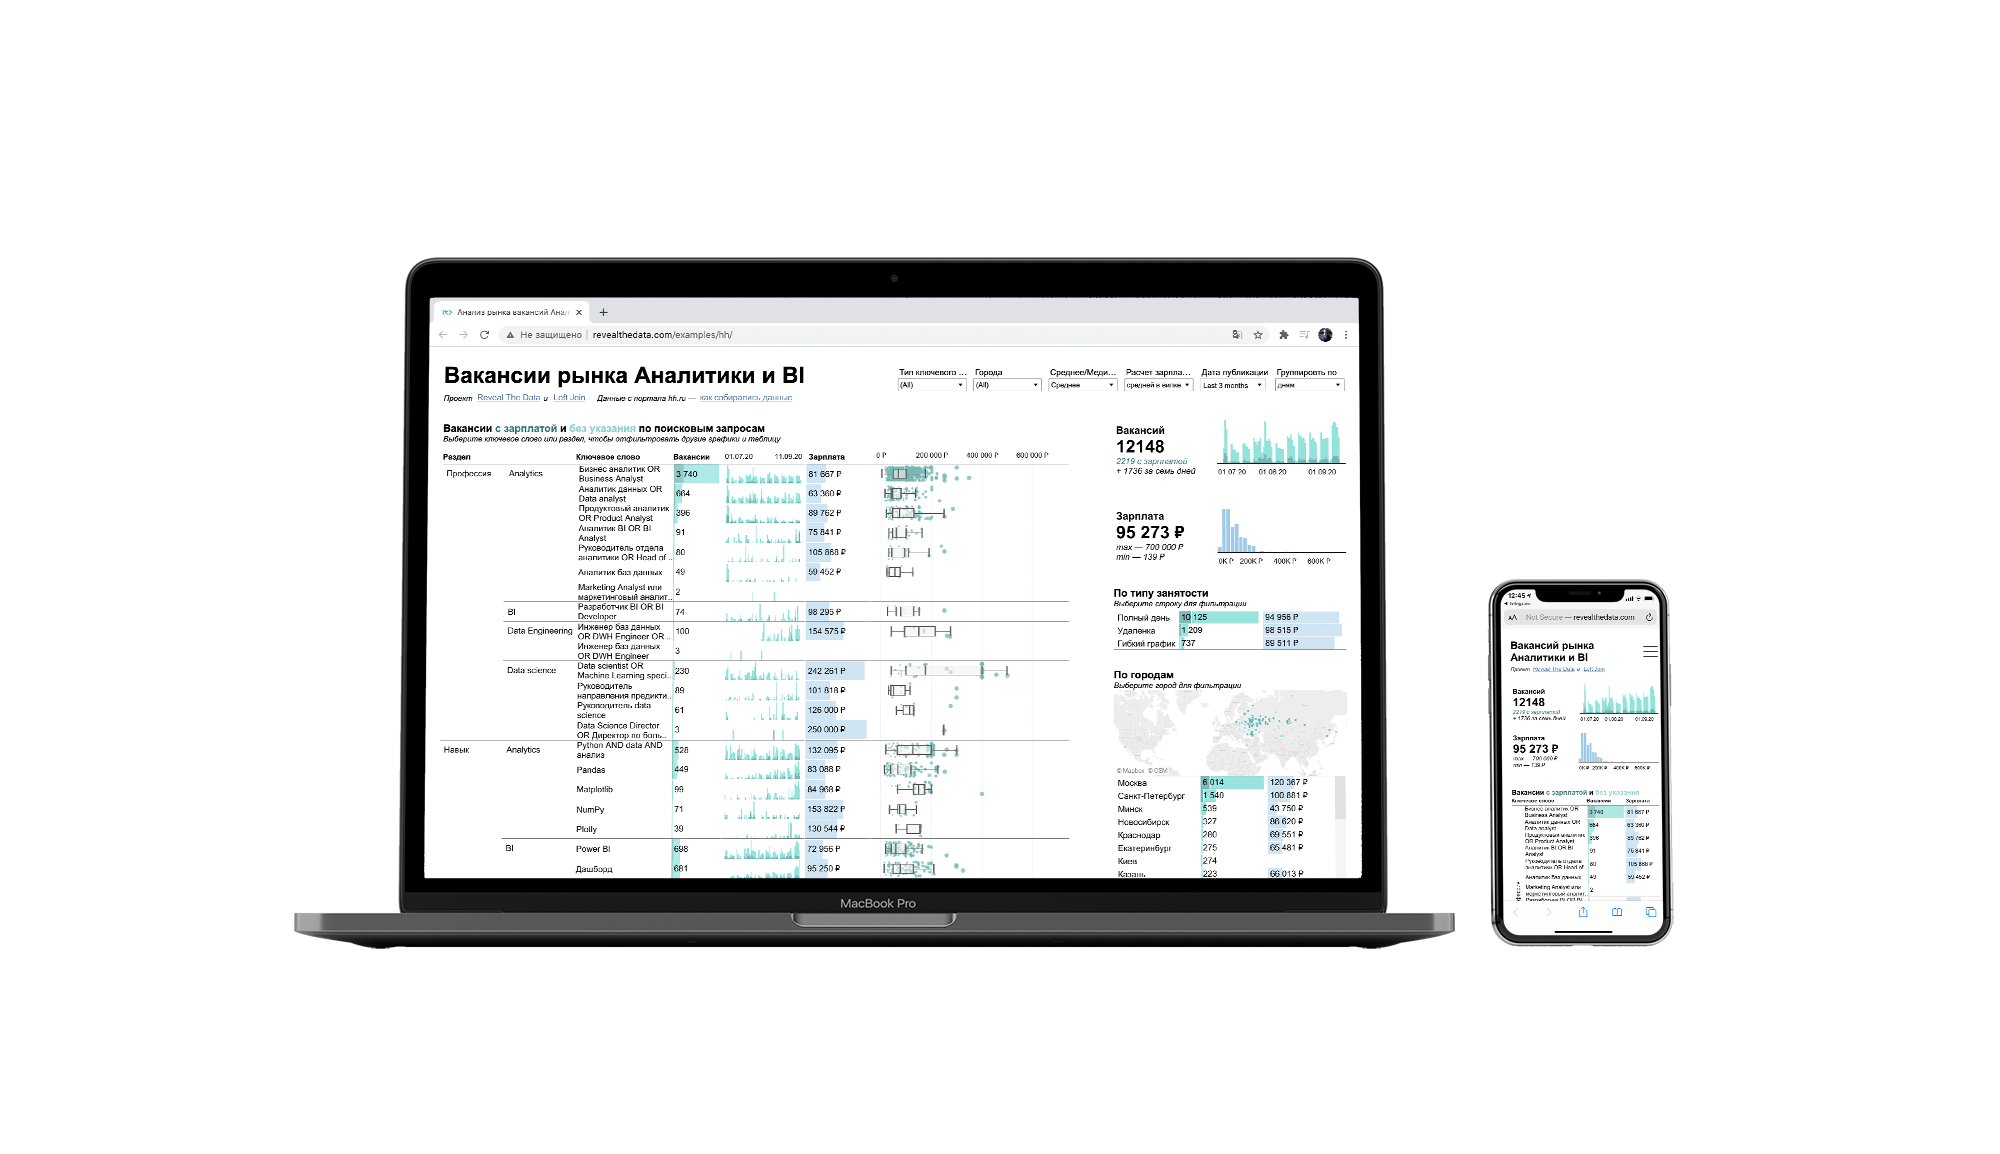
Previously we shared how to use Bootstrap components in building dashboard layout and designed a simple yet flexible dashboard with a scatter plot and Russian map. In today’s material, we will continue adding more information, explore how to make Bootstrap tables responsive, and cover some complex callbacks for data acquisition.

Constructing Data Tables

All the code for populating our tables with data will be stored in get_tables.py , while the layout components areoutlined in  application.py. This article will cover the process of creating the table with top Russian Breweries, however, you can find the code for creating the other three on Github.

Data in the Top Breweries table can be filtered by city name in the dropdown menu, but the data collected in Untappd is not equally structured. Some city names are written in Latin, others in Cyrillic. So the challenge is to make the names equal for SQL queries, and here is where Google Translate comes to the rescue. Though we sill have to manually create a dictionary of city names, since for example “Москва” can be written as “Moskva” and not “Moscow”. This dictionary will be used later for mapping our DataFrame before transforming it into a Bootstrap table.

import pandas as pd
import dash_bootstrap_components as dbc
from clickhouse_driver import Client
import numpy as np
from googletrans import Translator

translator = Translator()

client = Client(host='12.34.56.78', user='default', password='', port='9000', database='')

city_names = {
   'Moskva': 'Москва',
   'Moscow': 'Москва',
   'СПБ': 'Санкт-Петербург',
   'Saint Petersburg': 'Санкт-Петербург',
   'St Petersburg': 'Санкт-Петербург',
   'Nizhnij Novgorod': 'Нижний Новгород',
   'Tula': 'Тула',
   'Nizhniy Novgorod': 'Нижний Новгород',
}

Top Breweries Table

This table displays top 10 Russian breweries and their position change according to the rating. Simply put, we need to compare data for two periods, that’s [30 days ago; today] and [60 days ago; 30 days ago]. With this in mind, we will need the following headers: ranking, brewery name, position change, and number of check-ins.
Create the  get_top_russian_breweries function that would make queries to the Clickhouse DB, sort the data and return a refined Pandas DataFrame. Let’s send the following queries to obtain data for the past 30 and 60 days, ordering the results by the number of check-ins.


Querying data from the Database

def get_top_russian_breweries(checkins_n=250):
   top_n_brewery_today = client.execute(f'''
      SELECT  rt.brewery_id,
              rt.brewery_name,
              beer_pure_average_mult_count/count_for_that_brewery as avg_rating,
              count_for_that_brewery as checkins FROM (
      SELECT           
              brewery_id,
              dictGet('breweries', 'brewery_name', toUInt64(brewery_id)) as brewery_name,
              sum(rating_score) AS beer_pure_average_mult_count,
              count(rating_score) AS count_for_that_brewery
          FROM beer_reviews t1
          ANY LEFT JOIN venues AS t2 ON t1.venue_id = t2.venue_id
          WHERE isNotNull(venue_id) AND (created_at >= (today() - 30)) AND (venue_country = 'Россия') 
          GROUP BY           
              brewery_id,
              brewery_name) rt
      WHERE (checkins>={checkins_n})
      ORDER BY avg_rating DESC
      LIMIT 10
      '''
   )

top_n_brewery_n_days = client.execute(f'''
  SELECT  rt.brewery_id,
          rt.brewery_name,
          beer_pure_average_mult_count/count_for_that_brewery as avg_rating,
          count_for_that_brewery as checkins FROM (
  SELECT           
          brewery_id,
          dictGet('breweries', 'brewery_name', toUInt64(brewery_id)) as brewery_name,
          sum(rating_score) AS beer_pure_average_mult_count,
          count(rating_score) AS count_for_that_brewery
      FROM beer_reviews t1
      ANY LEFT JOIN venues AS t2 ON t1.venue_id = t2.venue_id
      WHERE isNotNull(venue_id) AND (created_at >= (today() - 60) AND created_at <= (today() - 30)) AND (venue_country = 'Россия')
      GROUP BY           
          brewery_id,
          brewery_name) rt
  WHERE (checkins>={checkins_n})
  ORDER BY avg_rating DESC
  LIMIT 10
  '''
)

Creating two DataFrames with the received data:

top_n = len(top_n_brewery_today)
column_names = ['brewery_id', 'brewery_name', 'avg_rating', 'checkins']

top_n_brewery_today_df = pd.DataFrame(top_n_brewery_today, columns=column_names).replace(np.nan, 0)
top_n_brewery_today_df['brewery_pure_average'] = round(top_n_brewery_today_df.avg_rating, 2)
top_n_brewery_today_df['brewery_rank'] = list(range(1, top_n + 1))

top_n_brewery_n_days = pd.DataFrame(top_n_brewery_n_days, columns=column_names).replace(np.nan, 0)
top_n_brewery_n_days['brewery_pure_average'] = round(top_n_brewery_n_days.avg_rating, 2)
top_n_brewery_n_days['brewery_rank'] = list(range(1, len(top_n_brewery_n_days) + 1))

And then calculate the position change over the period of time for each brewery received. With the try-except block, we will handle exceptions, in case, if a brewery was not yet in our database 60 days ago.

rank_was_list = []
for brewery_id in top_n_brewery_today_df.brewery_id:
   try:
       rank_was_list.append(
           top_n_brewery_n_days[top_n_brewery_n_days.brewery_id == brewery_id].brewery_rank.item())
   except ValueError:
       rank_was_list.append('–')
top_n_brewery_today_df['rank_was'] = rank_was_list

Now we iterate over the columns with current and former positions. If there is no hyphen contained in, we will append an up or down arrow depending on the change.

diff_rank_list = []
for rank_was, rank_now in zip(top_n_brewery_today_df['rank_was'], top_n_brewery_today_df['brewery_rank']):
   if rank_was != '–':
       difference = rank_was - rank_now
       if difference > 0:
           diff_rank_list.append(f'↑ +{difference}')
       elif difference < 0:
           diff_rank_list.append(f'↓ {difference}')
       else:
           diff_rank_list.append('–')
   else:
       diff_rank_list.append(rank_was)

Finally, replace DataFrame headers, inserting the column with current ranking positions, where the top 3 will be displayed with the trophy emoji.

df = top_n_brewery_today_df[['brewery_name', 'avg_rating', 'checkins']].round(2)
df.insert(2, 'Position change', diff_rank_list)
df.columns = ['NAME', 'RATING', 'POSITION CHANGE', 'CHECK-INS']
df.insert(0, 'RANKING', list('🏆 ' + str(i) if i in [1, 2, 3] else str(i) for i in range(1, len(df) + 1)))

return df

Filtering data by city name

One of the main tasks we set before creating this dashboard was to find out what are the most liked breweries in a certain city. The user chooses a city in the dropdown menu and gets the results. Sound pretty simple, but is it that easy?
Our next step is to write a script that would update data for each city and store it in separate CSV files. As we mentioned earlier, the city names are not equally structured, so we need to use Google Translator within the if-else block, and since it may not convert some names to Cyrillic we need to explicitly specify such cases:

en_city = venue_city
if en_city == 'Nizhnij Novgorod':
      ru_city = 'Нижний Новгород'
elif en_city == 'Perm':
      ru_city = 'Пермь'
elif en_city == 'Sergiev Posad':
      ru_city = 'Сергиев Посад'
elif en_city == 'Vladimir':
      ru_city = 'Владимир'
elif en_city == 'Yaroslavl':
      ru_city = 'Ярославль'
else:
      ru_city = translator.translate(en_city, dest='ru').text

Then we need to add both city names in English and Russian to the SQL query, to receive all check-ins sent from this city.

WHERE (rt.venue_city='{ru_city}' OR rt.venue_city='{en_city}')

Finally, we export received data into a CSV file in the following directory – data/cities.

df = top_n_brewery_today_df[['brewery_name', 'venue_city', 'avg_rating', 'checkins']].round(2)
df.insert(3, 'Position Change', diff_rank_list)
df.columns = ['NAME', 'CITY', 'RATING', 'POSITION CHANGE', 'CHECK-INS']
# MAPPING
df['CITY'] = df['CITY'].map(lambda x: city_names[x] if (x in city_names) else x)
# TRANSLATING
df['CITY'] = df['CITY'].map(lambda x: translator.translate(x, dest='en').text)
df.to_csv(f'data/cities/{en_city}.csv', index=False)
print(f'{en_city}.csv updated!')

Scheduling Updates

We will use the apscheduler library to automatically run the script and refresh data for each city in all_cities every day at 10:30 am (UTC).

from apscheduler.schedulers.background import BackgroundScheduler
from get_tables import update_best_breweries

all_cities = sorted(['Vladimir', 'Voronezh', 'Ekaterinburg', 'Kazan', 'Red Pakhra', 'Krasnodar',
             'Kursk', 'Moscow', 'Nizhnij Novgorod', 'Perm', 'Rostov-on-Don', 'Saint Petersburg',
             'Sergiev Posad', 'Tula', 'Yaroslavl'])

scheduler = BackgroundScheduler()
@scheduler.scheduled_job('cron', hour=10, misfire_grace_time=30)
def update_data():
   for city in all_cities:
       update_best_breweries(city)
scheduler.start()

Table from DataFrame

get_top_russian_breweries_table(venue_city, checkins_n=250)  will accept venue_city and checkins_n generating a Bootstrap Table with the top breweries. The second parameter value, checkins_n can be changed with the slider. If the city name is not specified, the function will return top Russian breweries table.

if venue_city == None: 
      selected_df = get_top_russian_breweries(checkins_n)
else: 
      en_city = venue_city

In other case the DataFrame will be constructed from a CSV file stored in data/cities/. Since the city column still may contain different names we should apply mapping and use a lambda expression with the map() method. The lambda function will compare values in the column against keys in city_names and if there is a match, the column value will be overwritten.
For instance, if df[‘CITY’] contains “СПБ”, a frequent acronym for Saint Petersburg, the value will be replaced, while for “Воронеж” it will remain unchanged.
And last but not least, we need to remove all duplicate rows from the table, add a column with a ranking position and return the first 10 rows. These would be the most liked breweries in a selected city.

df = pd.read_csv(f'data/cities/{en_city}.csv')     
df = df.loc[df['CHECK-INS'] >= checkins_n]
df.drop_duplicates(subset=['NAME', 'CITY'], keep='first', inplace=True)  
df.insert(0, 'RANKING', list('🏆 ' + str(i) if i in [1, 2, 3] else str(i) for i in range(1, len(df) + 1)))
selected_df = df.head(10)

After all DataFrame manipulations, the function returns a simply styled Bootstrap table of top breweries.


Bootstrap table layout in DBC

table = dbc.Table.from_dataframe(selected_df, striped=False,
                                bordered=False, hover=True,
                                size='sm',
                                style={'background-color': '#ffffff',
                                       'font-family': 'Proxima Nova Regular',
                                       'text-align':'center',
                                       'fontSize': '12px'},
                                className='table borderless'
                                )

return table

Layout structure

Add a Slider and a Dropdown menu with city names in application.py

To learn more about the Dashboard layout structure, please refer to our previous guide

checkins_slider_tab_1 = dbc.CardBody(
                           dbc.FormGroup(
                               [
                                   html.H6('Number of check-ins', style={'text-align': 'center'})),
                                   dcc.Slider(
                                       id='checkin_n_tab_1',
                                       min=0,
                                       max=250,
                                       step=25,
                                       value=250,  
                                       loading_state={'is_loading': True},
                                       marks={i: i for i in list(range(0, 251, 25))}
                                   ),
                               ],
                           ),
                           style={'max-height': '80px', 
                                  'padding-top': '25px'
                                  }
                       )

top_breweries = dbc.Card(
       [
           dbc.CardBody(
               [
                   dbc.FormGroup(
                       [
                           html.H6('Filter by city', style={'text-align': 'center'}),
                           dcc.Dropdown(
                               id='city_menu',
                               options=[{'label': i, 'value': i} for i in all_cities],
                               multi=False,
                               placeholder='Select city',
                               style={'font-family': 'Proxima Nova Regular'}
                           ),
                       ],
                   ),
                   html.P(id="tab-1-content", className="card-text"),
               ],
           ),
   ],
)

We’ll also need to add a callback function to update the table by dropdown menu and slider values:

@app.callback(
   Output("tab-1-content", "children"), [Input("city_menu", "value"),
                                         Input("checkin_n_tab_1", "value")]
)
def table_content(city, checkin_n):
   return get_top_russian_breweries_table(city, checkin_n)

Tada, the main table is ready! The dashboard can be used to receive up-to-date info about best Russian breweries, beers, and its rating across different regions, and help to make a better choice for an enjoyable tasting experience.

View the code on GitHub

 No comments    625   2020   BI-tools   bootstrap   dash   plotly   python

Analyzing Business Intelligence (BI) and Analytics job market in Tableau

Время чтения текста – 13 минут

According to the SimilarWeb rating, hh.ru is the third among the most popular job search websites in the world. In one of the conversations with Roman Bunin, we came up with the idea of making a common project and collect data using the HeadHunter API for later analysis and visualization in Tableau Public. Our goal was to understand the dependency between salary and skills specified in a job posting and compare how things are in Moscow, Saint Petersburg, and other regions.

Data Collection Process

Our scheme is based on fetching a  brief job description, returned by the GET /vacancies method. According to the structure we need to create the following columns: vacancy type, id, vacancy rate (‘premium’), pre-employment testing (‘has_test’), company address, salary, work schedule, and so forth. We created a table using the following CREATE query down below:


Query for creating the vacancies_short table in ClickHouse

CREATE TABLE headhunter.vacancies_short
(
    `added_at` DateTime,
    `query_string` String,
    `type` String,
    `level` String,
    `direction` String,
    `vacancy_id` UInt64,
    `premium` UInt8,
    `has_test` UInt8,
    `response_url` String,
    `address_city` String,
    `address_street` String,
    `address_building` String,
    `address_description` String,
    `address_lat` String,
    `address_lng` String,
    `address_raw` String,
    `address_metro_stations` String,
    `alternate_url` String,
    `apply_alternate_url` String,
    `department_id` String,
    `department_name` String,
    `salary_from` Nullable(Float64),
    `salary_to` Nullable(Float64),
    `salary_currency` String,
    `salary_gross` Nullable(UInt8),
    `name` String,
    `insider_interview_id` Nullable(UInt64),
    `insider_interview_url` String,
    `area_url` String,
    `area_id` UInt64,
    `area_name` String,
    `url` String,
    `published_at` DateTime,
    `employer_url` String,
    `employer_alternate_url` String,
    `employer_logo_urls_90` String,
    `employer_logo_urls_240` String,
    `employer_logo_urls_original` String,
    `employer_name` String,
    `employer_id` UInt64,
    `response_letter_required` UInt8,
    `type_id` String,
    `type_name` String,
    `archived` UInt8,
    `schedule_id` Nullable(String)
)
ENGINE = ReplacingMergeTree
ORDER BY vacancy_id

The first script collects data from the HeadHunter website through API and inserts to our Database using the following libraries:

import requests
from clickhouse_driver import Client
from datetime import datetime
import pandas as pd
import re

Next, we create a DataFrame and connect to the Database in ClickHouse:

queries = pd.read_csv('hh_data.csv')
client = Client(host='1.234.567.890', user='default', password='', port='9000', database='headhunter')

The queries table stores a list of our search queries, having the following columns: query type, level, career field, and search phrase. The last column contains logical operators, for instance, we can get more results by putting logical ANDs between “Python”, “data” and “analysis”.

The search results may not always match the expectations, chiefs, marketers, and administrators can accidentally get into our database. To prevent this, we will write a function named check_name(name), it will accept a vacancy name and return a boolean value, depending on the match.

def check_name(name):
    bad_names = [r'курьер', r'грузчик', r'врач', r'менеджер по закупу',
           r'менеджер по продажам', r'оператор', r'повар', r'продавец',
          r'директор магазина', r'директор по продажам', r'директор по маркетингу',
          r'кабельщик', r'начальник отдела продаж', r'заместитель', r'администратор магазина', 
          r'категорийный', r'аудитор', r'юрист', r'контент', r'супервайзер', r'стажер-ученик', 
          r'су-шеф', r'маркетолог$', r'региональный', r'ревизор', r'экономист', r'ветеринар', 
          r'торговый', r'клиентский', r'начальник цеха', r'территориальный', r'переводчик', 
          r'маркетолог /', r'маркетолог по']
    for item in bad_names:
        if re.match(item, name):
            return True

Moving further, we need to create a while loop to collect data non-stop. Iterate over the Dataframe queries selecting the type, level, field, and search phrase columns. Send a GET request using a keyword to get the number of pages. Then we loop through the number of pages sending the same requests and populating vacancies_from_response with job descriptions. In the per_page parameter we specified 10, this is the max limit for the HH API. Since we didn’t pass any value to the area field, the results are collected worldwide.

while True:
   for query_type, level, direction, query_string in zip(queries['Query Type'], queries['Level'], queries['Career Field'], queries['Seach Phrase']):
           print(f'seach phrase: {query_string}')
           url = 'https://api.hh.ru/vacancies'
           par = {'text': query_string, 'per_page':'10', 'page':0}
           r = requests.get(url, params=par).json()
           added_at = datetime.now().strftime('%Y-%m-%d %H:%M:%S')
           pages = r['pages']
           found = r['found']
           vacancies_from_response = []

           for i in range(0, pages + 1):
               par = {'text': query_string, 'per_page':'10', 'page':i}
               r = requests.get(url, params=par).json()
               try:
                   vacancies_from_response.append(r['items'])
               except Exception as E:
                   continue

Create a for loop to escape duplicate rows in our table. First, send a query to the database, verifying whether there is a vacancy with the same id and search phrase. If the verification was successful we then
pass the job title to check_name() and move on to the next one.

for item in vacancies_from_response:
               for vacancy in item:
                   if client.execute(f"SELECT count(1) FROM vacancies_short WHERE vacancy_id={vacancy['id']} AND query_string='{query_string}'")[0][0] == 0:
                       name = vacancy['name'].replace("'","").replace('"','')
                       if check_name(name):
                           continue

Now we need to extract all the necessary data from a job description. The table will contain empty cells, since some data may be missing.


View the code for extracting job description data

vacancy_id = vacancy['id']
                       is_premium = int(vacancy['premium'])
                       has_test = int(vacancy['has_test'])
                       response_url = vacancy['response_url']
                       try:
                           address_city = vacancy['address']['city']
                           address_street = vacancy['address']['street']
                           address_building = vacancy['address']['building']
                           address_description = vacancy['address']['description']
                           address_lat = vacancy['address']['lat']
                           address_lng = vacancy['address']['lng']
                           address_raw = vacancy['address']['raw']
                           address_metro_stations = str(vacancy['address']['metro_stations']).replace("'",'"')
                       except TypeError:
                           address_city = ""
                           address_street = ""
                           address_building = ""
                           address_description = ""
                           address_lat = ""
                           address_lng = ""
                           address_raw = ""
                           address_metro_stations = ""
                       alternate_url = vacancy['alternate_url']
                       apply_alternate_url = vacancy['apply_alternate_url']
                       try:
                           department_id = vacancy['department']['id']
                       except TypeError as E:
                           department_id = ""
                       try:
                           department_name = vacancy['department']['name']
                       except TypeError as E:
                           department_name = ""
                       try:
                           salary_from = vacancy['salary']['from']
                       except TypeError as E:
                           salary_from = "cast(Null as Nullable(UInt64))"
                       try:
                           salary_to = vacancy['salary']['to']
                       except TypeError as E:
                           salary_to = "cast(Null as Nullable(UInt64))"
                       try:
                           salary_currency = vacancy['salary']['currency']
                       except TypeError as E:
                           salary_currency = ""
                       try:
                           salary_gross = int(vacancy['salary']['gross'])
                       except TypeError as E:
                           salary_gross = "cast(Null as Nullable(UInt8))"
                       try:
                           insider_interview_id = vacancy['insider_interview']['id']
                       except TypeError:
                           insider_interview_id = "cast(Null as Nullable(UInt64))"
                       try:
                           insider_interview_url = vacancy['insider_interview']['url']
                       except TypeError:
                           insider_interview_url = ""
                       area_url = vacancy['area']['url']
                       area_id = vacancy['area']['id']
                       area_name = vacancy['area']['name']
                       url = vacancy['url']
                       published_at = vacancy['published_at']
                       published_at = datetime.strptime(published_at,'%Y-%m-%dT%H:%M:%S%z').strftime('%Y-%m-%d %H:%M:%S')
                       try:
                           employer_url = vacancy['employer']['url']
                       except Exception as E:
                           print(E)
                           employer_url = ""
                       try:
                           employer_alternate_url = vacancy['employer']['alternate_url']
                       except Exception as E:
                           print(E)
                           employer_alternate_url = ""
                       try:
                           employer_logo_urls_90 = vacancy['employer']['logo_urls']['90']
                           employer_logo_urls_240 = vacancy['employer']['logo_urls']['240']
                           employer_logo_urls_original = vacancy['employer']['logo_urls']['original']
                       except Exception as E:
                           print(E)
                           employer_logo_urls_90 = ""
                           employer_logo_urls_240 = ""
                           employer_logo_urls_original = ""
                       employer_name = vacancy['employer']['name'].replace("'","").replace('"','')
                       try:
                           employer_id = vacancy['employer']['id']
                       except Exception as E:
                           print(E)
                       response_letter_required = int(vacancy['response_letter_required'])
                       type_id = vacancy['type']['id']
                       type_name = vacancy['type']['name']
                       is_archived = int(vacancy['archived'])

The last field is the work schedule. If there is mentioned a fly-in-fly-out method, these kinds of job postings will be skipped.

try:
    schedule = vacancy['schedule']['id']
except Exception as E:
    print(E)
    schedule = ''"
if schedule == 'flyInFlyOut':
    continue

Next, we create a list of obtained variables, replacing None values with empty strings to escape errors with Clickhouse and insert them into the table.

vacancies_short_list = [added_at, query_string, query_type, level, direction, vacancy_id, is_premium, has_test, response_url, address_city, address_street, address_building, address_description, address_lat, address_lng, address_raw, address_metro_stations, alternate_url, apply_alternate_url, department_id, department_name,
salary_from, salary_to, salary_currency, salary_gross, insider_interview_id, insider_interview_url, area_url, area_name, url, published_at, employer_url, employer_logo_urls_90, employer_logo_urls_240,  employer_name, employer_id, response_letter_required, type_id, type_name, is_archived, schedule]
for index, item in enumerate(vacancies_short_list):
    if item is None:
        vacancies_short_list[index] = ""
tuple_to_insert = tuple(vacancies_short_list)
print(tuple_to_insert)
client.execute(f'INSERT INTO vacancies_short VALUES {tuple_to_insert}')

Connecting Tableau to the data source

Unfortunately, we can’t work with databases in  Tableau Public, that’s why we decided to connect our Clickhouse Database to Google Sheets. With this in mind, we picked the following libraries: gspread and oauth2client for accessing Google Spreadsheets API, and schedule for task scheduling.

Refer to our previous article where we used  Google Spreadseets API for  Collecting Data on Ad Campaigns from VK.com

import schedule
from clickhouse_driver import Client
import gspread
import pandas as pd
from oauth2client.service_account import ServiceAccountCredentials
from datetime import datetime

scope = ['https://spreadsheets.google.com/feeds', 'https://www.googleapis.com/auth/drive']
client = Client(host='54.227.137.142', user='default', password='', port='9000', database='headhunter')
creds = ServiceAccountCredentials.from_json_keyfile_name('credentials.json', scope)
gc = gspread.authorize(creds)

The update_sheet() function will transfer all data from Clickhouse to a Google Sheets table:

def update_sheet():
   print('Updating cell at', datetime.now())
   columns = []
   for item in client.execute('describe table headhunter.vacancies_short'):
       columns.append(item[0])
   vacancies = client.execute('SELECT * FROM headhunter.vacancies_short')
   df_vacancies = pd.DataFrame(vacancies, columns=columns)
   df_vacancies.to_csv('vacancies_short.csv', index=False)
   content = open('vacancies_short.csv', 'r').read()
   gc.import_csv('1ZWS2kqraPa4i72hzp0noU02SrYVo0teD7KZ0c3hl-UI', content.encode('utf-8'))

Using schedule to run our function every day at 1:00 PM (UTC):

schedule.every().day.at("13:00").do(update_sheet)
while True:
   schedule.run_pending()

What’s the final point?

Roman created an informative dashboard based on this data.

And made a youtube video with a detailed explanation of the dashboard features.

Key Insights

  1. Data Analysts specializing in BI are most in-demand in the job market since the highest number of search results were returned with this query. However, the average salary is higher in Product Analyst and BI-analyst openings.
  2. Most of the postings were found In Moscow, where the average salary is 10-30K RUB higher than in Saint Petersburg and 30-40K higher than in other regions.
  3. Top highly paid positions: Head of Analytics (110K RUB per month on avg.), Database Engineer (138K RUB per month), and Head of Machine Learning (250K RUB per month).
  4. The most useful skills to have are a solid knowledge of Python with Pandas and Numpy, Tableau, Power BI, ETL, and Spark. Most of the posings found contained these requirements and were highly paid than any others. For Python programmers, it’s more valuable to have expertise with Matplotlib than Plotly.

View the code on  GitHub

 No comments    275   2020   Analytics engineering   BI-tools   data analytics   headhunter

Pandas Profiling in action: reviewing a new EDA library on Superstore Sales dataset

Время чтения текста – 8 минут

Before moving directly to data analysis we need to understand what type of data we are going to work with. In today’s material, we will take a closer look at the SuperStore Sales dataset, specifically at the Orders column. It includes customer shopping data of a Canadian online supermarket, such as order, product and customer ids, type of shipping, prices, product categories, names and etc. You can find more information about this dataset on GitHub. After creating a pandas DataFrame we can simply use the describe() method to get a sense of our data.

import pandas as pd

df = pd.read_csv('superstore_sales_orders.csv', decimal=',')
df.describe(include='all')

And oftentimes it leads to such a mess:

The source code of this library is available on GitHub

If we spend some time trying to get a grasp of this descriptive table, we can find out that customers are more likely to choose “Regular air” as a shipping type or that the majority of orders were made from Ontario. Nevertheless, there is a better tool to describe the dataset in more detail  – the pandas-profiling library. Just pass a DataFrame to it and we will get a generated HTML page with a detailed description of our dataset:

import pandas_profiling
profile = pandas_profiling.ProfileReport(df)
profile.to_file("output.html")

As you see, it returned a page with 6 sections, namely: overview, variables, interactions and correlations, number of missing values, and dataset samples.

View a full version of the Pandas Profiling Report

Data overview

Let’s move to the first subsection called “Overview”. Pandas Profiling provided the following stats: number of variables, number of observations, missing cells, duplicates, and file size. The  Variable types column shows that our DataFrame consists of 12 categorical and 9 numerical variables.

The  “Reproduction” subsection stores technical information, showing how long it took to analyze the dataset, currently installed version , configuration info and etc.

The  “Warnings” subsection informs about possible issues in the dataset structure. Now, it warns us that the “Order Date” column has too many distinct values.

Variables

Moving further, this subsection contains a detailed description of each variable, displaying the number of duplicates and missing values stored, memory size, maximum and minimal values. Right next to the stats you can see the distribution of column values.

Clicking on  Toggle details you will see more expanded information: quartiles, median and other useful descriptive statistical indicators. The remaining tabs contain a histogram displayed on the main screen, top 10 frequent values and extremes.

Interactions

This section displays how variables are interconnected on a hexbin plot: The graph looks not very obvious and clear, since the legend is lacking.

Correlations

The section represents correlations between variables calculated in a variety of ways. For example, the first tab shows Pearson’s r-value. It is noticeable that Profit is positively correlated with Sales. You can get a detailed explanation to each coefficient by clicking on the Toggle correlation descriptions button.

Missing values

This section includes a bar chart, matrix, and dendrogram with the number of fields in each variable. For instance, the  Product Base Margin column is missing three values.

Samples

And the final section show the first and last 10 rows as chunks of a dataset, pretty similar to the  head() method in Pandas.

Key Takeaways

The library is definitely more focused on statistics than Pandas, one can get useful descriptive stats for each variable and see their correlation. It provides a comprehensive report on a dataset in a user-friendly way, allowing to undertake an initial investigation and get a sense of data.
Still, the library has its shortfalls. If your dataset is fairly large the report generation time may be extended up to several hours. It’s a great tool for automating EDA tasks, however, it can’t do all the work for you and some details may be overlooked. If you are just getting started with data analysis, we would highly recommend to start it with pandas. It will solidify your knowledge and boost confidence in working with data.

 No comments    350   2020   BI-tools   pandas   pandas-profiling   python   visualisation

Collecting Data on Ad Campaigns from VK.com

Время чтения текста – 11 минут

We have a lot to share in today’s longread: we’ll retrieve data on ad campaigns from Vkontakte (widely popular social network in Russia and CIS countries) and compare them to Google Analytics data in Redash. This time we don’t need to create a server, as our data will be transferred to Google Docs via Google Sheets API.

Getting an Access Token
We need to create an app to receive our access token. Follow this link https://vk.com/apps?act=manage and click “Create app” on the developer’s page. Choose a name for your app and check it as a “Standalone app”. Then, click Settings in the left menu and save your app ID.

More details on access tokens can be found here: Getting an access token

Copy this link:

https://oauth.vk.com/authorize?client_id=YourClientID&scope=ads&response_type=token

And change YourClientID to your app ID, this will allow you to get information about your advertising account. Open this link in your browser and you will be redirected to another page, which URL address holds your generated access token.

Access token expires in 86400 seconds or 24 hours. If you want to generate a token with an unlimited lifetime period, just pass scope to the offline parameter. In case if you need to generate a new token – change your password account or terminate all active sessions in security settings.

You will also need your advertising account ID to make API requests. It can be found via this link, just copy it:  https://vk.com/ads?act=settings

Using APIs to collect data
Let’s write a script that would allow us to retrieve information on all user’s ad campaigns: number of impressions, сlicks and costs. The script will pass this data to a DataFrame and send it to Google Docs.

from oauth2client.service_account import ServiceAccountCredentials
from pandas import DataFrame
import requests
import gspread
import time

We have several constant variables: access token, advertising account ID and Vkontakte API Version. Here we are using the most recent API version, which is 5.103.

token = 'fa258683fd418fafcab1fb1d41da4ec6cc62f60e152a63140c130a730829b1e0bc'
version = 5.103
id_rk = 123456789

To get advertising stats you need to use the  ads.getStatistics method and pass your ad campaign ID to it. Since we don’t run any advertisements yet, we’ll use the  ads.getAds method that returns IDs of ads and campaigns.

Learn more about the API methods available for Vkontakte here

Use the requests library to send a request and convert the response to JSON.


campaign_ids = []
ads_ids = []
r = requests.get('https://api.vk.com/method/ads.getAds', params={
    'access_token': token,
    'v': version,
    'account_id': id_rk
})
data = r.json()['response']

We have a familiar list of dictionaries returned, similar to the one we have reviewed in the previous article, “Analysing data on Facebook Ad Campaigns with Redash”.

Fill in the ad_campaign_dict dictionary as follows: specify ad ID as a key, and campaign ID as a value, where this ad belongs to.

ad_campaign_dict = {}
for i in range(len(data)):
    ad_campaign_dict[data[i]['id']] = data[i]['campaign_id']

Having ID for every ad needed we can invoke the  ads.getStatistics method to collect data on the number of impressions, clicks, costs, and dates for a particular ad, so create several empty lists in advance.

ads_campaign_list = []
ads_id_list = []
ads_impressions_list = []
ads_clicks_list = []
ads_spent_list = []
ads_day_start_list = []
ads_day_end_list = []

We need to invoke the getStatistics method for each ad separately, let’s refer to the ad_campaign_dict and iterate our requests. Retrieve all-time data by calling the ‘period’ method with the  ‘overall’ value. Some ads may not have impression or clicks if they haven’t been launched yet, this may cause a  KeyError. Let’s recall to the try — except approach to handle this error.

for ad_id in ad_campaign_dict:
        r = requests.get('https://api.vk.com/method/ads.getStatistics', params={
            'access_token': token,
            'v': version,
            'account_id': id_rk,
            'ids_type': 'ad',
            'ids': ad_id,
            'period': 'overall',
            'date_from': '0',
            'date_to': '0'
        })
        try:
            data_stats = r.json()['response']
            for i in range(len(data_stats)):
                for j in range(len(data_stats[i]['stats'])):
                    ads_impressions_list.append(data_stats[i]['stats'][j]['impressions'])
                    ads_clicks_list.append(data_stats[i]['stats'][j]['clicks'])
                    ads_spent_list.append(data_stats[i]['stats'][j]['spent'])
                    ads_day_start_list.append(data_stats[i]['stats'][j]['day_from'])
                    ads_day_end_list.append(data_stats[i]['stats'][j]['day_to'])
                    ads_id_list.append(data_stats[i]['id'])
                    ads_campaign_list.append(ad_campaign_dict[ad_id])
        except KeyError:
            continue

Now, create a DataFrame and print out the first 5 data points

df = DataFrame()
df['campaign_id'] = ads_campaign_list
df['ad_id'] = ads_id_list
df['impressions'] = ads_impressions_list
df['clicks'] = ads_clicks_list
df['spent'] = ads_spent_list
df['day_start'] = ads_day_start_list
df['day_end'] = ads_day_end_list
print(df.head())

Exporting Data to Google Docs
We’ll need a Google API access token, navigate to https://console.developers.google.com and create one. Choose any name you like, then go to your Dashboard and click “Enable APIs and Services”. Choose Google Drive API from the list, enable it and do exactly the same for Google Sheets API.

After activation you will be redirected to the API control panel. Click Credentials – Create Credentials, click choose data type and create an account. Choosing a role is optional, just proceed and specify JSON as a key type.

After these steps you can download a JSON file with your credentials, we’ll rename it to «credentials.json». On the main page you’ll find the email field – copy your email address.

Go to https://docs.google.com/spreadsheets and create a new file named data, we’ll pass data from our DataFrame to it. Put the  credentials.json file in one directory with the script and continue coding. Add these links to the scope list:

scope = ['https://spreadsheets.google.com/feeds', 'https://www.googleapis.com/auth/drive']

We will use the  ServiceAccountCredentials.from_json_keyfile_name and  gspread.authorize methods available in the  oauth2client and  gspread libraries for authenticaion process. Specify your file name and the scope variable in the ServiceAccountCredentials.from_json_keyfile_name method. The  sheet variable will allow us to send requests to our file in Google Docs.

creds = ServiceAccountCredentials.from_json_keyfile_name('credentials.json', scope)
client = gspread.authorize(creds)
sheet = client.open('data').sheet1

Apply the update_cell method to enter new value in a table cell. It’s worth mentioning that the indexing starts at 0, not 1. With the first loop we’ll move the column names of our DataFrame. And with the following loops we’ll move the rest of our data points. The default limits allow us to make 100 loops for 100 seconds. These restrictions may cause errors and stop our script, that’s why we need to use time.sleep and make the script sleep for 1 second after each loop.

count_of_rows = len(df)
count_of_columns = len(df.columns)
for i in range(count_of_columns):
    sheet.update_cell(1, i + 1, list(df.columns)[i])
for i in range(1, count_of_rows + 1):
    for j in range(count_of_columns):
        sheet.update_cell(i + 1, j + 1, str(df.iloc[i, j]))
        time.sleep(1)

In case of success, you’ll get the same table:

Exporting data to Redash

See how you can connect Google Analytics to Redash in this article «How to connect Google Analytics to Redash?».

Having a table with Google Analytics and ad campaigns from Vkontakte exported we can compare them by writing the following query:

SELECT
    query_50.day_start,
    CASE WHEN ga_source LIKE '%vk%' THEN 'vk.com' END AS source,
    query_50.spent,
    query_50.impressions,
    query_50.clicks,
    SUM(query_49.ga_sessions) AS sessions,
    SUM(query_49.ga_newUsers) AS users
FROM query_49
JOIN query_50
ON query_49.ga_date = query_50.day_start
WHERE query_49.ga_source LIKE '%vk%' AND DATE(query_49.ga_date) BETWEEN '2020-05-16' AND '2020-05-20'
GROUP BY query_49.ga_date, source

ga_source — the traffic source, from which a user was redirected. Use the  CASE method to combine everything that contains “vk” in one column called «vk.com». With the help of JOIN operator we can add the table with the data on ad campaigns, merging by date. Let’s take the day of the last ad campaign and a couple of days after, this will result in the following output:

Takeaways
Now we have a table that reflects how much were spent in ad costs on a certain day, the number of users who viewed this ad, were engaged and redirected to our website, and then completed the sign-up process.

 No comments    604   2020   Analytics engineering   BI-tools   data analytics   longread

Analysing data on Facebook Ad Campaigns with Redash

Время чтения текста – 4 минуты

Our previous article was dedicated to collecting data on Facebook ad campaigns. Today we will analyze this data using Redash. As a first step, we need to upload our script to AWS cloud and create a server with AIOHTTP before passing the data to Redash. Let’s improve the script a little bit for this task:

from facebook_business.api import FacebookAdsApi
from facebook_business.adobjects.adaccount import AdAccount
from facebook_business.adobjects.adreportrun import AdReportRun
from facebook_business.adobjects.adsinsights import AdsInsights
from facebook_business.adobjects.adaccountuser import AdAccountUser as AdUser
from facebook_business.exceptions import FacebookRequestError
import time

Redash receives data in JSON format, which we haven’t covered yet. A JSON file is a file that consists of a list of dictionaries. The script will convert it to JSON and pass the data to Redash. We’ll need the variable that stores our access token, app id, app secret and two functions: wait_for_async_job() and get_insights(). The latter function receives account parameters and collects data on ad campaigns. Select the following fields: clicks, impressions, costs and dates.

We need the entire script from our previous article – Collecting Data on Facebook Ad Campaigns

The return_json() function will call the get_insights(), which will append data to insights_lists. Since we may have several ad campaigns, our output can be a list of lists with dictionaries instead of just a list of dictionaries. Create a simple lambda expression that will smooth the output and return our insights_lists_flatten. Now, the script returns a list of dictionaries:

def return_json():
   insights_lists = []
   date_preset = 'last_year'
   for elem in my_accounts:
       elem_insights = get_insights(elem, date_preset)
       insights_lists.append(elem_insights)
   flatten = lambda lst: [item for sublist in lst for item in sublist]
   insights_lists_flatten = flatten(insights_lists)
   return insights_lists_flatten

We also need a AIOHTTP server that will return our output as JSON. Create a new file, import the AIOHTTP library and the get_json() function from the preceding script. Write a simple query handler: the script will receive data from Facebook asynchronously and our asynchronous handler function will sleep until all data is collected and transferred. The function uses json_response to transfer data in json format.

from aiohttp import web
from get_json import return_json
async def handler(request):
   data = return_json()
   return web.json_response(data)

Initialize and run our application.

app = web.Application()
app.add_routes([web.get('/json', handler)])
web.run_app(app)

Now, go to AWS cloud, create a new folder and upload the two scripts via SFTP connection. Check if the needed port is open, click console — network & security — security groups — default.

Run our file from the server. You can check whether it works by accessing it via server IP address specifying 0880 in the route field. Connect to Redash using URL and we’ll get the same table returned by our script:

url: server ip

Having query results, we can write the following query:

select date_start, sum(clicks) as clicks, sum(impressions) as impressions, sum(spend) as spend from query_45
group by date_start

It returns this table, grouped by the date_start column:

We can now plot this data on the chart, let’s see if there is any correlation between ad costs and clicks:

Bingo! Next time, we will show you how to get data on ad campaigns from Vkontakte.

 No comments    616   2020   BI-tools   data analytics   redash
Earlier Ctrl + ↓